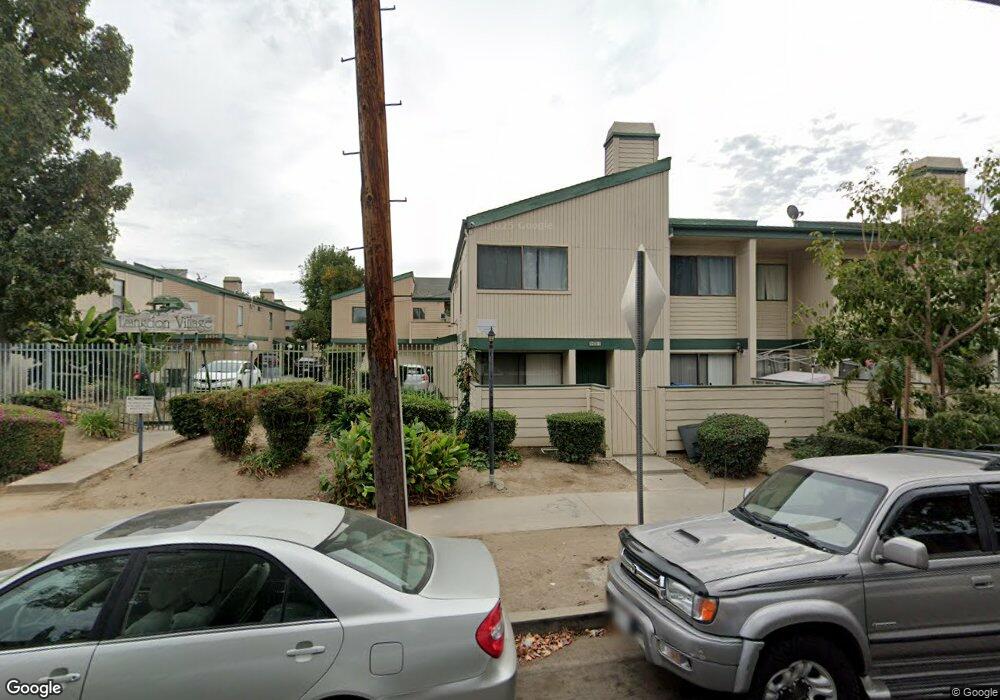
8438 Langdon Ave Unit 4 North Hills, CA 91343
Estimated Value: $390,000 - $491,000
2
Beds
3
Baths
1,142
Sq Ft
$397/Sq Ft
Est. Value
About This Home
This home is located at 8438 Langdon Ave Unit 4, North Hills, CA 91343 and is currently estimated at $453,111, approximately $396 per square foot. 8438 Langdon Ave Unit 4 is a home located in Los Angeles County with nearby schools including Langdon Avenue Elementary School, Vista Middle School, and Panorama High School.
Ownership History
Date
Name
Owned For
Owner Type
Purchase Details
Closed on
Aug 20, 2009
Sold by
The Bank Of New York Mellon
Bought by
Asatouri Jurik and Grigorian Ruzan
Current Estimated Value
Purchase Details
Closed on
Jun 25, 2009
Sold by
Gonzalez Luis D and Correa Janet
Bought by
The Bank Of New York Mellon
Purchase Details
Closed on
Oct 7, 2005
Sold by
Noubleau Ricardo and Noubleau Anna
Bought by
Gonzalez Luis D and Correa Janet
Home Financials for this Owner
Home Financials are based on the most recent Mortgage that was taken out on this home.
Original Mortgage
$268,000
Interest Rate
7.5%
Mortgage Type
Purchase Money Mortgage
Purchase Details
Closed on
May 8, 2003
Sold by
Calderon Lidia Julieta
Bought by
Noubleau Ricardo and Noubleau Anna
Home Financials for this Owner
Home Financials are based on the most recent Mortgage that was taken out on this home.
Original Mortgage
$132,000
Interest Rate
3%
Create a Home Valuation Report for This Property
The Home Valuation Report is an in-depth analysis detailing your home's value as well as a comparison with similar homes in the area
Home Values in the Area
Average Home Value in this Area
Purchase History
| Date | Buyer | Sale Price | Title Company |
|---|---|---|---|
| Asatouri Jurik | $120,500 | Lsi Title Company Ca | |
| The Bank Of New York Mellon | $228,322 | None Available | |
| Gonzalez Luis D | $335,000 | Southland Title | |
| Noubleau Ricardo | $166,000 | Fidelity National Title Co |
Source: Public Records
Mortgage History
| Date | Status | Borrower | Loan Amount |
|---|---|---|---|
| Previous Owner | Gonzalez Luis D | $268,000 | |
| Previous Owner | Noubleau Ricardo | $132,000 | |
| Closed | Noubleau Ricardo | $33,000 |
Source: Public Records
Tax History Compared to Growth
Tax History
| Year | Tax Paid | Tax Assessment Tax Assessment Total Assessment is a certain percentage of the fair market value that is determined by local assessors to be the total taxable value of land and additions on the property. | Land | Improvement |
|---|---|---|---|---|
| 2025 | $2,017 | $155,526 | $31,099 | $124,427 |
| 2024 | $2,017 | $152,478 | $30,490 | $121,988 |
| 2023 | $1,981 | $149,490 | $29,893 | $119,597 |
| 2022 | $1,890 | $146,559 | $29,307 | $117,252 |
| 2021 | $1,862 | $143,686 | $28,733 | $114,953 |
| 2019 | $1,808 | $139,427 | $27,882 | $111,545 |
| 2018 | $1,775 | $136,694 | $27,336 | $109,358 |
| 2016 | $1,685 | $131,387 | $26,275 | $105,112 |
| 2015 | $1,661 | $129,415 | $25,881 | $103,534 |
| 2014 | $1,674 | $126,881 | $25,375 | $101,506 |
Source: Public Records
Map
Nearby Homes
- 8505 Columbus Ave Unit 316
- 8505 Columbus Ave Unit 107
- 8417 Columbus Ave
- 8626 Marklein Ave
- 15430 Parthenia St
- 15554 Parthenia St Unit 6
- 15527 Parthenia St Unit 18
- 15724 Chase St
- 8601 Burnet Ave Unit D
- 15229 Burton St
- 8745 Parthenia Place
- 8530 Burnet Ave Unit 107
- 15200 Roscoe
- 8070 Langdon Ave
- 8621 Noble Ave Unit 4
- 8531 Norwich Ave
- 8744 Burnet Ave Unit 7
- 8020 Langdon Ave Unit 208
- 8020 Langdon Ave Unit 211
- 15040 Parthenia St
- 8458 Langdon Ave
- 8454 Langdon Ave
- 8434 Langdon Ave
- 8430 Langdon Ave
- 8442 Langdon Ave Unit 4
- 8450 Langdon Ave Unit 1
- 8434 Langdon Ave Unit 1
- 8430 Langdon Ave Unit 3
- 8430 Langdon Ave Unit 2
- 8430 Langdon Ave Unit 1
- 8434 Langdon Ave Unit 6
- 8434 Langdon Ave Unit 5
- 8434 Langdon Ave Unit 4
- 8434 Langdon Ave Unit 3
- 8434 Langdon Ave Unit 2
- 8438 Langdon Ave Unit 6
- 8438 Langdon Ave Unit 5
- 8438 Langdon Ave Unit 3
- 8438 Langdon Ave Unit 2
- 8438 Langdon Ave Unit 1