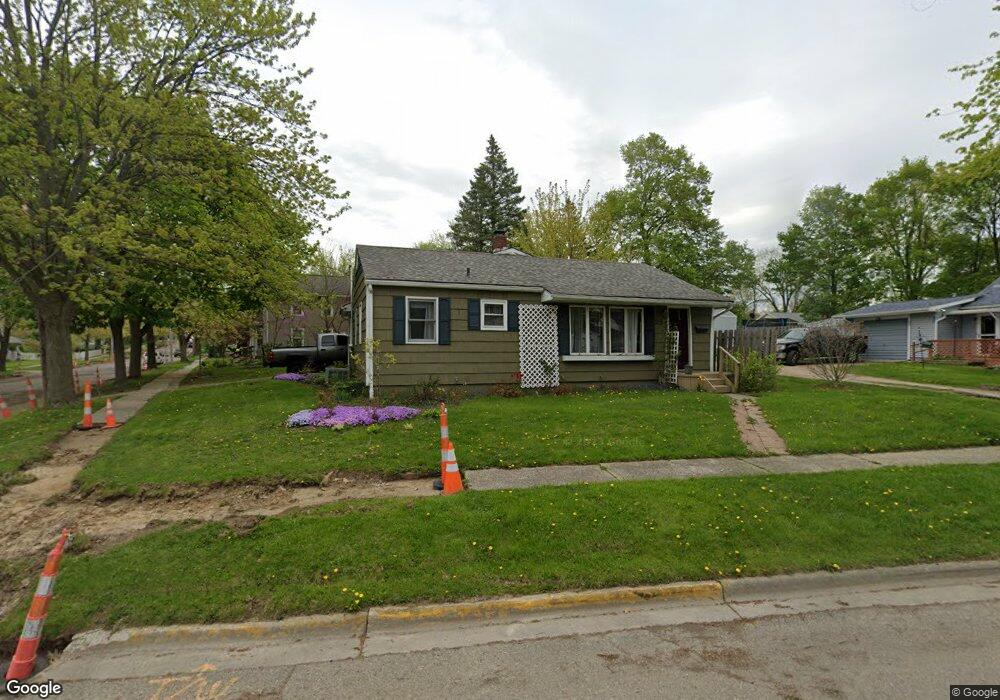
844 Elm St Adrian, MI 49221
Estimated Value: $127,000 - $159,000
3
Beds
2
Baths
1,369
Sq Ft
$106/Sq Ft
Est. Value
About This Home
This home is located at 844 Elm St, Adrian, MI 49221 and is currently estimated at $145,616, approximately $106 per square foot. 844 Elm St is a home located in Lenawee County with nearby schools including Adrian High School, St. Joseph Academy, and St. Joseph's Academy.
Ownership History
Date
Name
Owned For
Owner Type
Purchase Details
Closed on
Mar 31, 2016
Sold by
Rose Acceptance Inc
Bought by
Lornie Lisa
Current Estimated Value
Purchase Details
Closed on
Feb 1, 2014
Sold by
Rose Acceptance Inc
Bought by
First National Bank Of America
Purchase Details
Closed on
Mar 1, 2013
Sold by
Rose Acceptance Inc
Bought by
First National Bank Of America A Nationa
Purchase Details
Closed on
Jul 12, 2012
Sold by
Blohm Rickey D and Blohm Robin Y
Bought by
Rose Acceptance Inc
Create a Home Valuation Report for This Property
The Home Valuation Report is an in-depth analysis detailing your home's value as well as a comparison with similar homes in the area
Home Values in the Area
Average Home Value in this Area
Purchase History
| Date | Buyer | Sale Price | Title Company |
|---|---|---|---|
| Lornie Lisa | $40,000 | None Available | |
| First National Bank Of America | -- | None Available | |
| First National Bank Of America A Nationa | -- | None Available | |
| Rose Acceptance Inc | $38,034 | None Available |
Source: Public Records
Tax History
| Year | Tax Paid | Tax Assessment Tax Assessment Total Assessment is a certain percentage of the fair market value that is determined by local assessors to be the total taxable value of land and additions on the property. | Land | Improvement |
|---|---|---|---|---|
| 2025 | $1,898 | $55,200 | $0 | $0 |
| 2024 | $16 | $51,400 | $0 | $0 |
| 2023 | $2,125 | $47,000 | $0 | $0 |
| 2022 | $2,960 | $43,300 | $0 | $0 |
| 2021 | $1,628 | $40,000 | $0 | $0 |
| 2020 | $1,623 | $37,700 | $0 | $0 |
| 2019 | $92,480 | $33,900 | $0 | $0 |
| 2018 | $1,574 | $39,794 | $0 | $0 |
| 2017 | $1,508 | $33,041 | $0 | $0 |
| 2016 | $1,175 | $29,407 | $0 | $0 |
| 2014 | -- | $30,000 | $0 | $0 |
Source: Public Records
Map
Nearby Homes
- 820 Mulberry St
- 822 Elm St
- 717 Bristol St
- 803 Ormsby St
- 310 E Siena Heights Dr
- 417 E Hunt St
- 423 E Butler St
- 612 N Clinton St
- 229 Clinton St
- 924 Frank St
- 418 E Church St
- 603 S Center St
- 2751 Cloverdale Ave
- 371 Riverside Ave
- 228 W Church St
- 306 Summer St
- 2550 Bent Oak Ave
- 625 Division St
- 322 Lawrence Ave
- 632 Division St
Your Personal Tour Guide
Ask me questions while you tour the home.