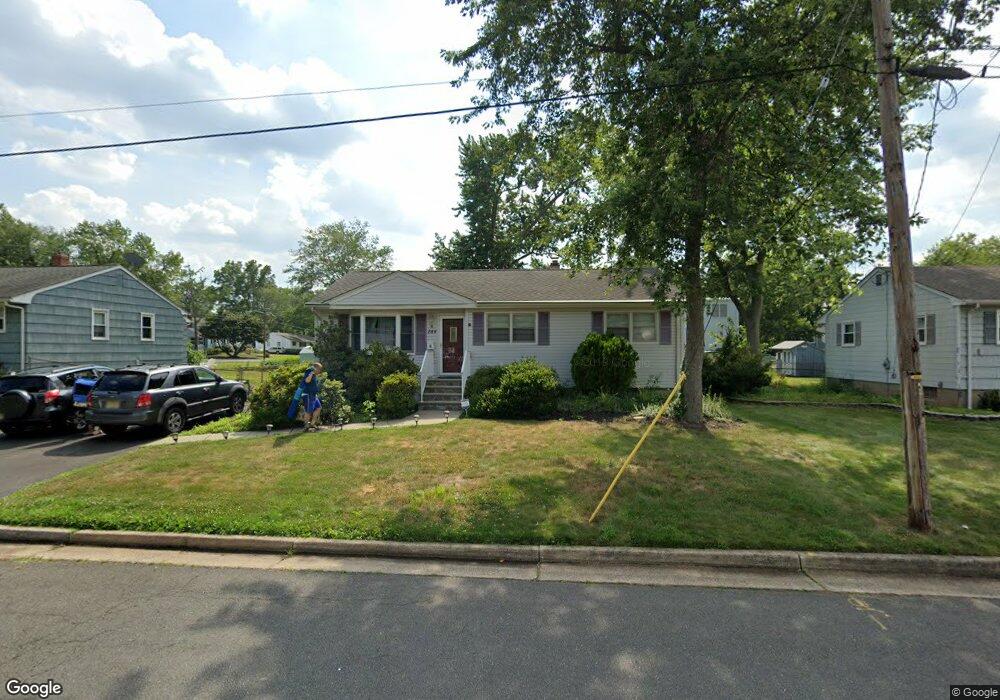
844 Eva St Piscataway, NJ 08854
Estimated Value: $463,000 - $491,000
--
Bed
--
Bath
1,032
Sq Ft
$464/Sq Ft
Est. Value
About This Home
This home is located at 844 Eva St, Piscataway, NJ 08854 and is currently estimated at $479,061, approximately $464 per square foot. 844 Eva St is a home located in Middlesex County with nearby schools including Dwight D. Eisenhower School, Arbor Intermediate School, and Quibbletown Middle School.
Ownership History
Date
Name
Owned For
Owner Type
Purchase Details
Closed on
Sep 15, 2021
Sold by
Costa Ronald J
Bought by
Costa Ronald J and Costa Michele
Current Estimated Value
Purchase Details
Closed on
Jan 28, 2021
Sold by
Ardizzone James M and Last Will & Testament Of James
Bought by
Costa Ronald J
Home Financials for this Owner
Home Financials are based on the most recent Mortgage that was taken out on this home.
Original Mortgage
$275,000
Interest Rate
2.7%
Mortgage Type
New Conventional
Purchase Details
Closed on
Jul 31, 2008
Sold by
Ardizzone Vallijean
Bought by
Ardizzone James F
Purchase Details
Closed on
Jul 6, 2001
Sold by
Czuba Edward
Bought by
Ardizzoner Jiames
Home Financials for this Owner
Home Financials are based on the most recent Mortgage that was taken out on this home.
Original Mortgage
$141,000
Interest Rate
7.18%
Create a Home Valuation Report for This Property
The Home Valuation Report is an in-depth analysis detailing your home's value as well as a comparison with similar homes in the area
Home Values in the Area
Average Home Value in this Area
Purchase History
| Date | Buyer | Sale Price | Title Company |
|---|---|---|---|
| Costa Ronald J | -- | Liberty Title & Escrow Co | |
| Costa Ronald J | -- | Liberty Title & Escrow | |
| Costa Ronald J | $275,000 | Liberty Title & Escrow Co | |
| Ardizzone James F | -- | Chicago Title Insurance Co | |
| Ardizzoner Jiames | $184,900 | -- |
Source: Public Records
Mortgage History
| Date | Status | Borrower | Loan Amount |
|---|---|---|---|
| Previous Owner | Costa Ronald J | $275,000 | |
| Previous Owner | Ardizzoner Jiames | $141,000 |
Source: Public Records
Tax History Compared to Growth
Tax History
| Year | Tax Paid | Tax Assessment Tax Assessment Total Assessment is a certain percentage of the fair market value that is determined by local assessors to be the total taxable value of land and additions on the property. | Land | Improvement |
|---|---|---|---|---|
| 2025 | $6,066 | $404,500 | $304,000 | $100,500 |
| 2024 | $6,289 | $314,300 | $196,100 | $118,200 |
| 2023 | $6,289 | $304,400 | $196,100 | $108,300 |
| 2022 | $6,409 | $287,900 | $196,100 | $91,800 |
| 2021 | $6,159 | $265,800 | $183,600 | $82,200 |
| 2020 | $5,926 | $256,300 | $158,600 | $97,700 |
| 2019 | $5,925 | $251,800 | $158,600 | $93,200 |
| 2018 | $5,768 | $246,300 | $158,600 | $87,700 |
| 2017 | $5,685 | $209,700 | $123,600 | $86,100 |
| 2016 | $5,582 | $209,700 | $123,600 | $86,100 |
| 2015 | $5,498 | $209,700 | $123,600 | $86,100 |
| 2014 | $5,377 | $209,700 | $123,600 | $86,100 |
Source: Public Records
Map
Nearby Homes
- 155 Summers Ave
- 850 Mohill Place
- 900 S Washington Ave
- 113 Summers Ave
- 1514 S Washington Ave
- 114 Hamilton Blvd
- 35 Murray Ave
- 114 Woodrow Ave
- 150 Hamilton Blvd
- 24 Old New Brunswick Rd
- 72 Carlton Ave
- 145 Hopkinson Ave
- 267 Shady Oak Ct
- 84 Kossuth St
- 712 Lorhan Dr
- 185 Ward Place
- 634 S Washington Ave
- 632 Lorhan Dr
- 614 S Washington Ave
- 1122 Hanover St