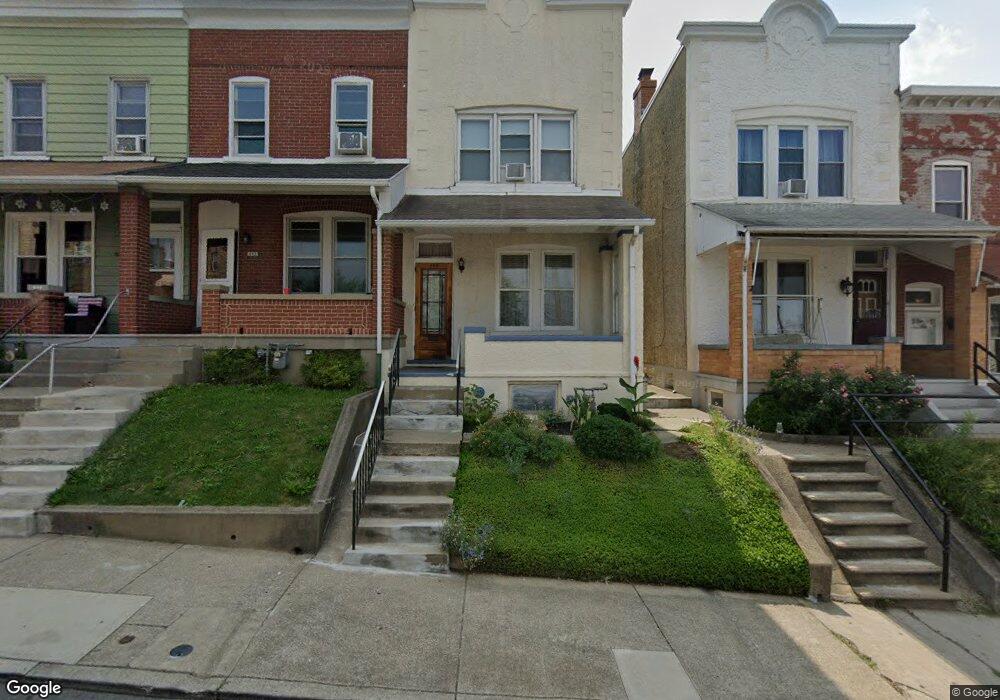
844 N Penn St Allentown, PA 18102
Center City NeighborhoodEstimated Value: $159,000 - $194,000
2
Beds
1
Bath
1,080
Sq Ft
$163/Sq Ft
Est. Value
About This Home
This home is located at 844 N Penn St, Allentown, PA 18102 and is currently estimated at $175,703, approximately $162 per square foot. 844 N Penn St is a home located in Lehigh County with nearby schools including Sheridan Elementary School, San Rafael Junior High School, and Trexler Middle School.
Ownership History
Date
Name
Owned For
Owner Type
Purchase Details
Closed on
Nov 23, 2009
Sold by
Stauffer Jeanette
Bought by
Moyer Philip S
Current Estimated Value
Home Financials for this Owner
Home Financials are based on the most recent Mortgage that was taken out on this home.
Original Mortgage
$75,605
Outstanding Balance
$49,012
Interest Rate
4.86%
Mortgage Type
FHA
Estimated Equity
$126,691
Purchase Details
Closed on
Oct 23, 1976
Bought by
Keglovitz Stella
Create a Home Valuation Report for This Property
The Home Valuation Report is an in-depth analysis detailing your home's value as well as a comparison with similar homes in the area
Home Values in the Area
Average Home Value in this Area
Purchase History
| Date | Buyer | Sale Price | Title Company |
|---|---|---|---|
| Moyer Philip S | $77,000 | -- | |
| Keglovitz Stella | -- | -- |
Source: Public Records
Mortgage History
| Date | Status | Borrower | Loan Amount |
|---|---|---|---|
| Open | Moyer Philip S | $75,605 |
Source: Public Records
Tax History Compared to Growth
Tax History
| Year | Tax Paid | Tax Assessment Tax Assessment Total Assessment is a certain percentage of the fair market value that is determined by local assessors to be the total taxable value of land and additions on the property. | Land | Improvement |
|---|---|---|---|---|
| 2025 | $1,902 | $58,400 | $5,200 | $53,200 |
| 2024 | $1,902 | $58,400 | $5,200 | $53,200 |
| 2023 | $1,902 | $58,400 | $5,200 | $53,200 |
| 2022 | $1,836 | $58,400 | $53,200 | $5,200 |
| 2021 | $1,799 | $58,400 | $5,200 | $53,200 |
| 2020 | $1,752 | $58,400 | $5,200 | $53,200 |
| 2019 | $1,724 | $58,400 | $5,200 | $53,200 |
| 2018 | $1,608 | $58,400 | $5,200 | $53,200 |
| 2017 | $1,568 | $58,400 | $5,200 | $53,200 |
| 2016 | -- | $58,400 | $5,200 | $53,200 |
| 2015 | -- | $58,400 | $5,200 | $53,200 |
| 2014 | -- | $58,400 | $5,200 | $53,200 |
Source: Public Records
Map
Nearby Homes
- 833 N 5th St
- 914 N 4th St
- 415 W Cedar St
- 424 W Cedar St
- 824 N 5th St
- 423 W Washington St
- 909 N 6th St
- 614 W Greenleaf St
- 837 N Jordan St
- 626 W Cedar St
- 431 Tilghman St
- 504 W Tilghman St
- 858 N 7th St
- 643 N 4th St
- 701 N Jordan St
- 717 W Cedar St
- 392 W Tilghman St
- 728 W Whitehall St
- 732 W Whitehall St
- 640 Park St