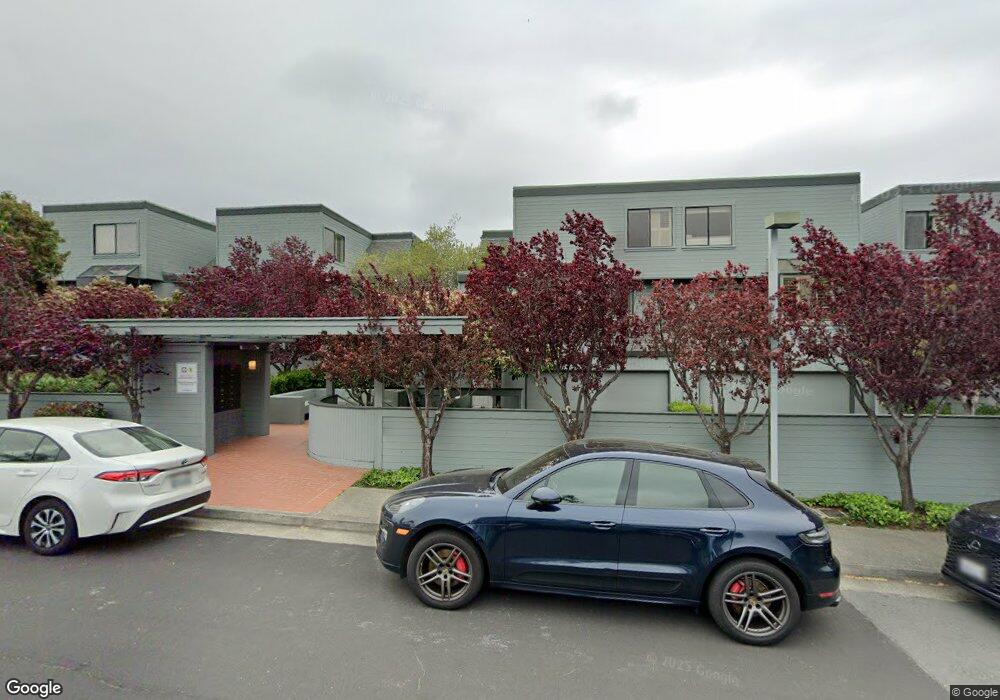
844 Olima St Sausalito, CA 94965
Estimated Value: $1,232,000 - $1,568,000
2
Beds
2
Baths
1,449
Sq Ft
$926/Sq Ft
Est. Value
About This Home
This home is located at 844 Olima St, Sausalito, CA 94965 and is currently estimated at $1,341,088, approximately $925 per square foot. 844 Olima St is a home located in Marin County with nearby schools including Dr. Martin Luther King, Jr. Academy - Nevada Campus, Tamalpais High School, and The New Village School.
Ownership History
Date
Name
Owned For
Owner Type
Purchase Details
Closed on
Jul 1, 2009
Sold by
Gockley R David
Bought by
Gockley R David
Current Estimated Value
Purchase Details
Closed on
Jun 10, 2005
Sold by
Cameron Anthony Elliott and Cameron Lydia Harvey
Bought by
Gockley R David
Home Financials for this Owner
Home Financials are based on the most recent Mortgage that was taken out on this home.
Original Mortgage
$740,000
Outstanding Balance
$383,585
Interest Rate
5.65%
Mortgage Type
Fannie Mae Freddie Mac
Estimated Equity
$957,503
Purchase Details
Closed on
Jan 14, 2000
Sold by
Cameron Anthony E and Cameron Lydia H H
Bought by
Cameron Anthony Elliott and Cameron Lydia Harvey
Purchase Details
Closed on
Dec 9, 1994
Sold by
Howard David John
Bought by
Cameron Anthony E and Cameron Lydia H
Create a Home Valuation Report for This Property
The Home Valuation Report is an in-depth analysis detailing your home's value as well as a comparison with similar homes in the area
Home Values in the Area
Average Home Value in this Area
Purchase History
| Date | Buyer | Sale Price | Title Company |
|---|---|---|---|
| Gockley R David | -- | None Available | |
| Gockley R David | $925,000 | -- | |
| Cameron Anthony Elliott | -- | -- | |
| Cameron Anthony E | $375,000 | Placer Title Co |
Source: Public Records
Mortgage History
| Date | Status | Borrower | Loan Amount |
|---|---|---|---|
| Open | Gockley R David | $740,000 | |
| Closed | Gockley R David | $92,500 |
Source: Public Records
Tax History
| Year | Tax Paid | Tax Assessment Tax Assessment Total Assessment is a certain percentage of the fair market value that is determined by local assessors to be the total taxable value of land and additions on the property. | Land | Improvement |
|---|---|---|---|---|
| 2025 | $17,597 | $1,314,745 | $515,698 | $799,047 |
| 2024 | $16,687 | $1,276,475 | $505,590 | $770,885 |
| 2023 | $16,250 | $1,239,193 | $495,677 | $743,516 |
| 2022 | $15,551 | $1,214,903 | $485,961 | $728,942 |
| 2021 | $15,393 | $1,191,085 | $476,434 | $714,651 |
| 2020 | $15,099 | $1,178,875 | $471,550 | $707,325 |
| 2019 | $14,708 | $1,155,768 | $462,307 | $693,461 |
| 2018 | $14,198 | $1,133,115 | $453,246 | $679,869 |
| 2017 | $13,909 | $1,110,905 | $444,362 | $666,543 |
| 2016 | $13,313 | $1,089,131 | $435,652 | $653,479 |
| 2015 | $12,254 | $975,000 | $437,500 | $537,500 |
| 2014 | $11,276 | $897,000 | $402,500 | $494,500 |
Source: Public Records
Map
Nearby Homes
- 846 Olima St Unit 15
- 91 Stanford Way
- 116 Stanford Way Unit 24
- 367 Eden Roc Unit 49
- 369 Eden Roc Unit 47
- 100 Eden Roc
- 81 Anchorage Rd
- 2 Lincoln Dr
- 209 Cypress Place
- 62 Cypress Place
- 191 Buchanan Dr
- 1 Issaquah Dock
- 17 E Pier
- 38 S 40 Dock
- 35 W Pier
- 12 S 40 Dock
- 13 S 40 Dock
- 31 S 40 Dock
- 6 Yellow Ferry Dock
- 16 Dutton Ct
- 840 Olima St
- 848 Olima St Unit 14
- 850 Olima St Unit 13
- 836 Olima St Unit 19
- 852 Olima St
- 834 Olima St Unit 20
- 856 Olima St
- 858 Olima St
- 830 Olima St Unit 21
- 860 Olima St
- 862 Olima St
- 828 Olima St
- 826 Olima St Unit 23
- 151 Stanford Way Unit 7
- 141 Stanford Way Unit 6
- 131 Stanford Way
- 160 Stanford Way Unit 44
- 121 Stanford Way
- 111 Stanford Way
- 144 Stanford Way
Your Personal Tour Guide
Ask me questions while you tour the home.