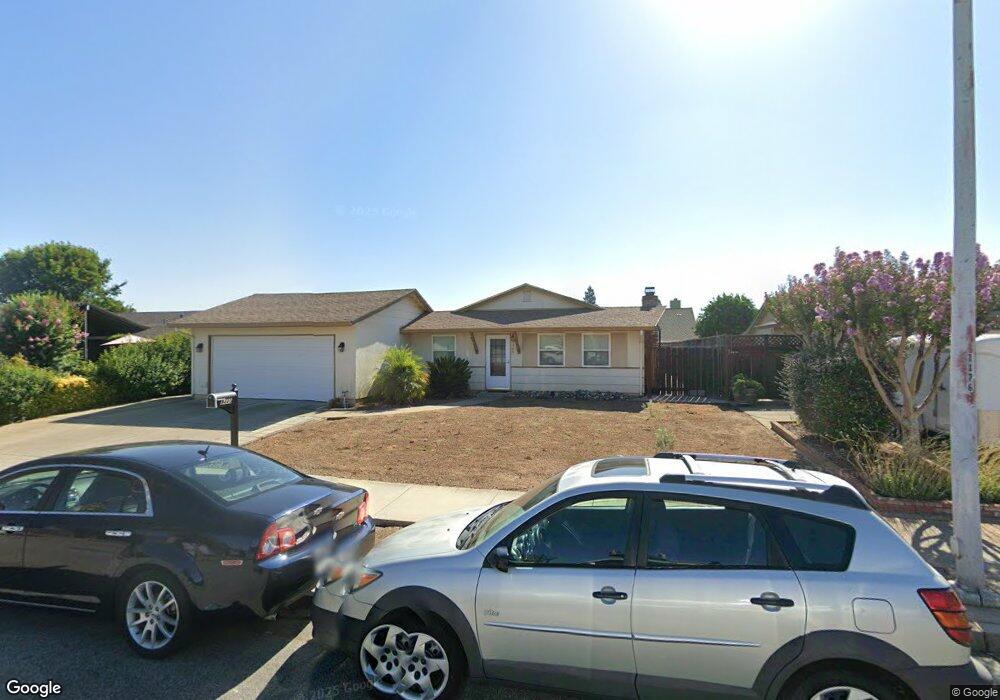
8440 Kelton Dr Gilroy, CA 95020
Las Animas NeighborhoodEstimated Value: $800,000 - $1,005,000
3
Beds
2
Baths
1,150
Sq Ft
$761/Sq Ft
Est. Value
About This Home
This home is located at 8440 Kelton Dr, Gilroy, CA 95020 and is currently estimated at $875,497, approximately $761 per square foot. 8440 Kelton Dr is a home located in Santa Clara County with nearby schools including Rod Kelley Elementary School, Solorsano Middle School, and South Valley Middle School.
Ownership History
Date
Name
Owned For
Owner Type
Purchase Details
Closed on
Jul 30, 2009
Sold by
Bank Of America National Association
Bought by
Delenia Eugene
Current Estimated Value
Home Financials for this Owner
Home Financials are based on the most recent Mortgage that was taken out on this home.
Original Mortgage
$240,000
Outstanding Balance
$155,521
Interest Rate
5.09%
Mortgage Type
New Conventional
Estimated Equity
$719,976
Purchase Details
Closed on
May 28, 2009
Sold by
Zavaleta Mitch R and Zavaleta Rosalie S
Bought by
Bank Of America National Association
Purchase Details
Closed on
Jul 29, 2004
Sold by
Harvey Richard C and Harvey Elizabeth J
Bought by
Zavaleta Mitch R and Zavaleta Rosalie S
Home Financials for this Owner
Home Financials are based on the most recent Mortgage that was taken out on this home.
Original Mortgage
$364,000
Interest Rate
5.5%
Mortgage Type
Purchase Money Mortgage
Purchase Details
Closed on
May 15, 1998
Sold by
Harvey Richard C and Harvey Elizabeth J
Bought by
Harvey Richard C and Harvey Elizabeth J
Create a Home Valuation Report for This Property
The Home Valuation Report is an in-depth analysis detailing your home's value as well as a comparison with similar homes in the area
Home Values in the Area
Average Home Value in this Area
Purchase History
| Date | Buyer | Sale Price | Title Company |
|---|---|---|---|
| Delenia Eugene | $300,000 | Fidelity National | |
| Bank Of America National Association | $195,500 | None Available | |
| Zavaleta Mitch R | $455,000 | Old Republic Title Company | |
| Harvey Richard C | -- | -- |
Source: Public Records
Mortgage History
| Date | Status | Borrower | Loan Amount |
|---|---|---|---|
| Open | Delenia Eugene | $240,000 | |
| Previous Owner | Zavaleta Mitch R | $364,000 | |
| Closed | Zavaleta Mitch R | $68,250 |
Source: Public Records
Tax History Compared to Growth
Tax History
| Year | Tax Paid | Tax Assessment Tax Assessment Total Assessment is a certain percentage of the fair market value that is determined by local assessors to be the total taxable value of land and additions on the property. | Land | Improvement |
|---|---|---|---|---|
| 2025 | $4,783 | $387,229 | $225,885 | $161,344 |
| 2024 | $4,783 | $379,637 | $221,456 | $158,181 |
| 2023 | $4,755 | $372,194 | $217,114 | $155,080 |
| 2022 | $4,676 | $364,897 | $212,857 | $152,040 |
| 2021 | $4,654 | $357,743 | $208,684 | $149,059 |
| 2020 | $4,604 | $354,076 | $206,545 | $147,531 |
| 2019 | $4,561 | $347,135 | $202,496 | $144,639 |
| 2018 | $4,262 | $340,329 | $198,526 | $141,803 |
| 2017 | $4,350 | $333,657 | $194,634 | $139,023 |
| 2016 | $4,258 | $327,116 | $190,818 | $136,298 |
| 2015 | $4,019 | $322,203 | $187,952 | $134,251 |
| 2014 | $3,994 | $315,893 | $184,271 | $131,622 |
Source: Public Records
Map
Nearby Homes
- 1297 Chesbro Way
- 958 Bosco Ln Unit 1603
- 8190 Westwood Dr
- 8170 Westwood Dr Unit 22
- 1206 Sycamore Ct
- 8105 Kern Ave Unit 33
- 1501 Welburn Ave
- 1555 Hecker Pass Rd Unit D201
- 796 Gary St
- 7950 English Oak Cir
- 7934 Spanish Oak Cir
- 1620 Welburn Ave
- 8255 Rancho Real
- 1544 Rosette Way Unit 27
- 780 Welburn Ave
- 8320 Chantrelle Ct
- 722 Carver Place
- 0 California 152
- 7832 Cobblestone Ct
- 8341 Winter Green Ct
- 8430 Kelton Dr
- 8460 Kelton Dr
- 8539 Silvia St
- 8549 Silvia St
- 8470 Kelton Dr
- 8420 Kelton Dr
- 8559 Silvia St
- 1050 Hoesch Way
- 1205 Chesbro Way
- 8480 Kelton Dr
- 1200 Chesbro Way Unit 3
- 8569 Silvia St
- 1100 Peterson Dr
- 1040 Hoesch Way
- 1195 Welburn Ave
- 1215 Chesbro Way
- 1187 Welburn Ave
- 1179 Welburn Ave
- 8490 Kelton Dr
- 1210 Chesbro Way Unit 3