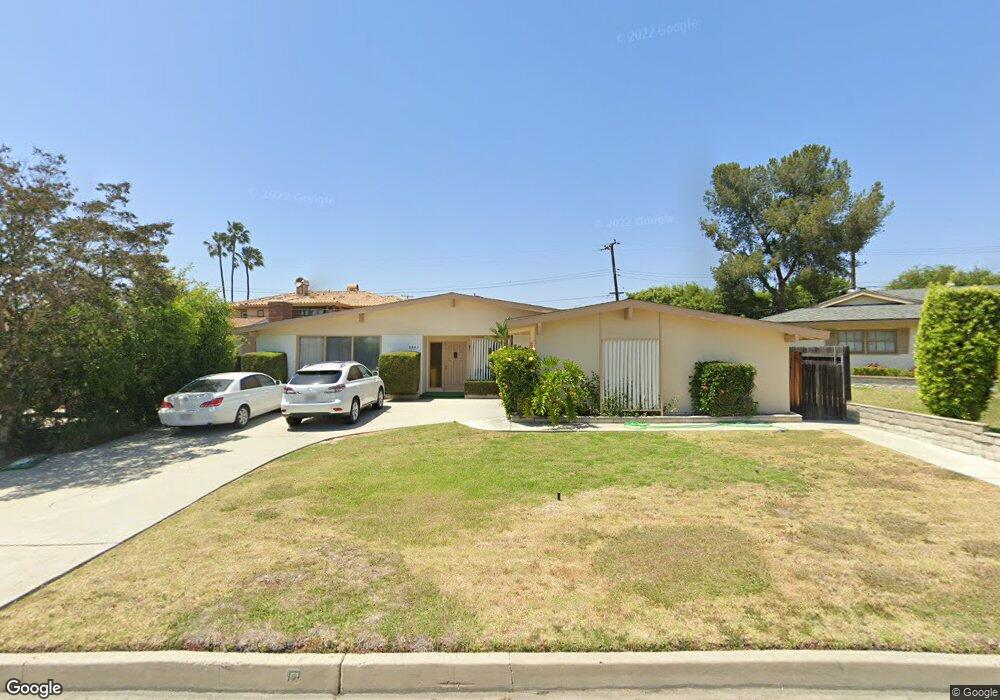
8441 Fox Hills Ave Buena Park, CA 90621
Estimated Value: $1,226,000 - $1,359,000
4
Beds
3
Baths
2,624
Sq Ft
$490/Sq Ft
Est. Value
About This Home
This home is located at 8441 Fox Hills Ave, Buena Park, CA 90621 and is currently estimated at $1,284,554, approximately $489 per square foot. 8441 Fox Hills Ave is a home located in Orange County with nearby schools including Charles G. Emery Elementary School, Buena Park Junior High School, and Sunny Hills High School.
Ownership History
Date
Name
Owned For
Owner Type
Purchase Details
Closed on
Jan 18, 2022
Sold by
Yoong And Jane Park Revocable Living Tru
Bought by
Yoong And Jane Park Revocable Living Trust
Current Estimated Value
Home Financials for this Owner
Home Financials are based on the most recent Mortgage that was taken out on this home.
Original Mortgage
$647,200
Outstanding Balance
$597,329
Interest Rate
3.22%
Mortgage Type
New Conventional
Estimated Equity
$687,225
Purchase Details
Closed on
Mar 5, 2019
Sold by
Park Yoong and Park Jane Lee
Bought by
Park Yoong and Park Jane Lee
Home Financials for this Owner
Home Financials are based on the most recent Mortgage that was taken out on this home.
Original Mortgage
$525,000
Interest Rate
4.4%
Mortgage Type
New Conventional
Purchase Details
Closed on
Jan 10, 2002
Sold by
Park Jane
Bought by
Park Yoong and Park Jane
Purchase Details
Closed on
Jan 26, 1995
Sold by
Park Yoong
Bought by
Park Jane
Create a Home Valuation Report for This Property
The Home Valuation Report is an in-depth analysis detailing your home's value as well as a comparison with similar homes in the area
Home Values in the Area
Average Home Value in this Area
Purchase History
| Date | Buyer | Sale Price | Title Company |
|---|---|---|---|
| Yoong And Jane Park Revocable Living Trust | -- | New Title Company Name | |
| Park Yoong | -- | Provident Title Company | |
| Park Yoong | -- | -- | |
| Park Jane | -- | -- |
Source: Public Records
Mortgage History
| Date | Status | Borrower | Loan Amount |
|---|---|---|---|
| Open | Yoong And Jane Park Revocable Living Trust | $647,200 | |
| Previous Owner | Park Yoong | $525,000 |
Source: Public Records
Tax History Compared to Growth
Tax History
| Year | Tax Paid | Tax Assessment Tax Assessment Total Assessment is a certain percentage of the fair market value that is determined by local assessors to be the total taxable value of land and additions on the property. | Land | Improvement |
|---|---|---|---|---|
| 2025 | $4,758 | $419,177 | $271,484 | $147,693 |
| 2024 | $4,758 | $410,958 | $266,160 | $144,798 |
| 2023 | $4,659 | $402,900 | $260,941 | $141,959 |
| 2022 | $4,582 | $395,000 | $255,824 | $139,176 |
| 2021 | $4,547 | $387,255 | $250,807 | $136,448 |
| 2020 | $4,490 | $383,285 | $248,236 | $135,049 |
| 2019 | $4,383 | $375,770 | $243,369 | $132,401 |
| 2018 | $4,298 | $368,402 | $238,597 | $129,805 |
| 2017 | $4,236 | $361,179 | $233,919 | $127,260 |
| 2016 | $4,151 | $354,098 | $229,333 | $124,765 |
| 2015 | $3,972 | $348,780 | $225,889 | $122,891 |
| 2014 | $3,957 | $341,948 | $221,464 | $120,484 |
Source: Public Records
Map
Nearby Homes
- 4900 Lincolnshire Ave
- 5211 Fox Hills Ave
- 8244 Henderson Green
- 4738 Durango Dr
- 5412 Arrowhead Ave
- 8237 Henshaw Cir
- 8542 Emerywood Dr
- 5471 Jonesboro Way
- 2150 Cheyenne Way Unit 169
- 14806 Faceta Dr
- 2200 Cheyenne Way Unit 117
- 14724 Mercado Ave
- 9 Coveside Ct
- 5588 Cajon Ave
- 14828 Rayfield Dr
- 65 Windward Way Unit 23
- 6 Tidewater Cove
- 86 Lakeside Dr
- 11 Travis Rd
- 15213 Santa Gertrudes Ave Unit W106
- 8431 Fox Hills Ave
- 8461 Fox Hills Ave
- 8406 Sunnybrook Ave
- 8412 Sunnybrook Ave
- 8481 Fox Hills Ave
- 8421 Fox Hills Ave
- 5041 Clifton Way
- 8402 Sunnybrook Ave
- 4937 Saint Andrews Ave
- 8491 Fox Hills Ave
- 8420 Sunnybrook Ave
- 5040 Clifton Way
- 8401 Fox Hills Ave
- 4941 Saint Andrews Ave
- 8412 Fox Hills Ave
- 8382 Sunnybrook Ave
- 5055 Clifton Way
- 5050 Clifton Way
- 8401 Sunnybrook Cir
- 8511 Fox Hills Ave