Estimated Value: $48,000 - $98,000
2
Beds
1
Bath
843
Sq Ft
$84/Sq Ft
Est. Value
About This Home
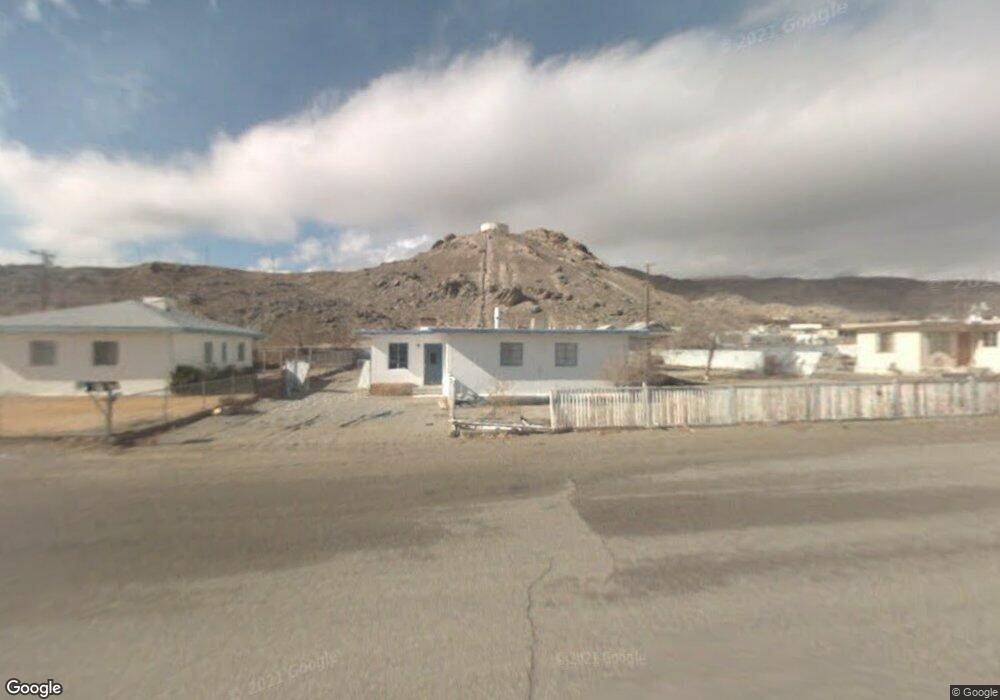
This home is located at 84420 8th St, Trona, CA 93562 and is currently estimated at $70,486, approximately $83 per square foot. 84420 8th St is a home located in San Bernardino County with nearby schools including Trona Elementary School and Trona High School.
Ownership History
Date
Name
Owned For
Owner Type
Purchase Details
Closed on
Feb 27, 2017
Sold by
Alvarez Jesus
Bought by
Faria Jadah Michelle
Current Estimated Value
Purchase Details
Closed on
Oct 4, 2013
Sold by
Brite Investments
Bought by
Alvarez Jesus
Purchase Details
Closed on
Apr 21, 2008
Sold by
Perkins Mary
Bought by
Brite Investments
Purchase Details
Closed on
Sep 20, 2007
Sold by
Dziurgot Francis
Bought by
Perkins Mary
Purchase Details
Closed on
Nov 21, 2005
Sold by
Li Hous Cooperation Inc
Bought by
Dziurgot Francis
Home Financials for this Owner
Home Financials are based on the most recent Mortgage that was taken out on this home.
Original Mortgage
$40,000
Interest Rate
6.25%
Mortgage Type
Stand Alone First
Purchase Details
Closed on
Sep 13, 2002
Sold by
Citifinancial Mtg Company Inc
Bought by
Lihous Co Operation Inc
Purchase Details
Closed on
May 29, 2002
Sold by
Murillo Victor M
Bought by
Citifinancial Mtg Company Llc and Associates Financial Svcs Co Of Ca Inc
Create a Home Valuation Report for This Property
The Home Valuation Report is an in-depth analysis detailing your home's value as well as a comparison with similar homes in the area
Purchase History
| Date | Buyer | Sale Price | Title Company |
|---|---|---|---|
| Faria Jadah Michelle | $8,000 | None Available | |
| Alvarez Jesus | $2,300 | None Available | |
| Brite Investments | -- | Southland Title | |
| Perkins Mary | -- | Accommodation | |
| Dziurgot Francis | $29,000 | First American Title Company | |
| Lihous Co Operation Inc | $4,500 | Lawyers Title Company | |
| Citifinancial Mtg Company Llc | $13,619 | American Title Co |
Source: Public Records
Mortgage History
| Date | Status | Borrower | Loan Amount |
|---|---|---|---|
| Previous Owner | Dziurgot Francis | $40,000 |
Source: Public Records
Tax History
| Year | Tax Paid | Tax Assessment Tax Assessment Total Assessment is a certain percentage of the fair market value that is determined by local assessors to be the total taxable value of land and additions on the property. | Land | Improvement |
|---|---|---|---|---|
| 2025 | $1,556 | $9,287 | $2,323 | $6,964 |
| 2024 | $963 | $9,104 | $2,277 | $6,827 |
| 2023 | $1,425 | $8,925 | $2,232 | $6,693 |
| 2022 | $793 | $8,750 | $2,188 | $6,562 |
| 2021 | $271 | $8,578 | $2,145 | $6,433 |
| 2020 | $266 | $8,490 | $2,123 | $6,367 |
| 2019 | $338 | $8,323 | $2,081 | $6,242 |
| 2018 | $179 | $8,160 | $2,040 | $6,120 |
| 2017 | $118 | $2,430 | $1,057 | $1,373 |
| 2016 | $117 | $2,382 | $1,036 | $1,346 |
| 2015 | $117 | $2,346 | $1,020 | $1,326 |
| 2014 | $117 | $2,300 | $1,000 | $1,300 |
Source: Public Records
Map
Nearby Homes
- 84432 8th St
- 84406 8th St
- 84442 8th St
- 13732 Benton St
- 84392 8th St
- 84431 7th St
- 13738 Benton St
- 84441 7th St
- 84452 8th St
- 13737 Sutter St
- 84382 8th St
- 13749 Sutter St
- 13714 Benton St
- 13748 Benton St
- 84464 8th St
- 13759 Sutter St
- 84372 8th St
- 84463 7th St
- 0 8th St Unit PW17243904
- 0 8th St Unit CV23122602
Your Personal Tour Guide
Ask me questions while you tour the home.