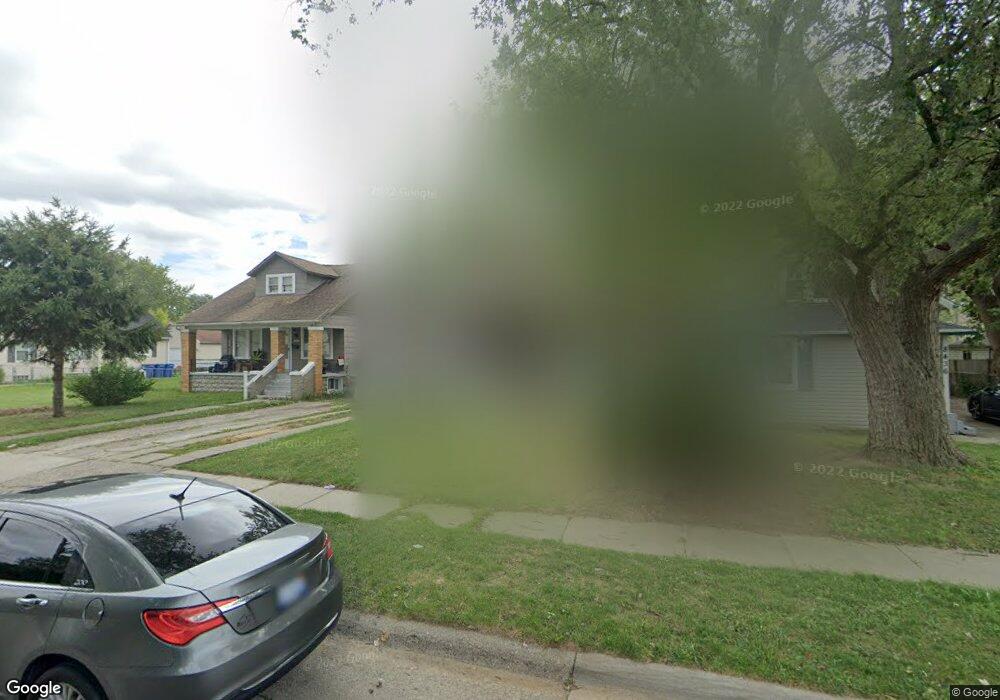
8444 Chapp Ave Warren, MI 48089
Southeast Warren NeighborhoodEstimated Value: $102,000 - $114,526
2
Beds
1
Bath
831
Sq Ft
$130/Sq Ft
Est. Value
About This Home
This home is located at 8444 Chapp Ave, Warren, MI 48089 and is currently estimated at $108,132, approximately $130 per square foot. 8444 Chapp Ave is a home located in Macomb County with nearby schools including Lincoln Middle School, Lincoln High School, and Center Line Preparatory Academy.
Ownership History
Date
Name
Owned For
Owner Type
Purchase Details
Closed on
Sep 13, 2017
Sold by
Harbour Portfolio Lp
Bought by
Financial Instruments Llc
Current Estimated Value
Purchase Details
Closed on
Jan 24, 2012
Sold by
Fannie Mae
Bought by
Harbour Portfolio Vii Lp
Purchase Details
Closed on
Dec 20, 2010
Sold by
Wells Fargo Ban Na
Bought by
Federal National Mortgage Association
Purchase Details
Closed on
Dec 17, 2010
Sold by
Yee Yue Ming
Bought by
Wells Fargo Bank Na
Purchase Details
Closed on
Oct 17, 2005
Sold by
Yee Yue Ming
Bought by
Ng Chun Yung
Purchase Details
Closed on
Apr 25, 2005
Sold by
Estate Of Robert Anthony Schultz
Bought by
Yee Yue Ming
Create a Home Valuation Report for This Property
The Home Valuation Report is an in-depth analysis detailing your home's value as well as a comparison with similar homes in the area
Home Values in the Area
Average Home Value in this Area
Purchase History
| Date | Buyer | Sale Price | Title Company |
|---|---|---|---|
| Financial Instruments Llc | -- | None Available | |
| Harbour Portfolio Vii Lp | $4,130 | None Available | |
| Federal National Mortgage Association | -- | None Available | |
| Wells Fargo Bank Na | $50,413 | None Available | |
| Ng Chun Yung | -- | None Available | |
| Yee Yue Ming | $69,000 | Summit Title |
Source: Public Records
Tax History
| Year | Tax Paid | Tax Assessment Tax Assessment Total Assessment is a certain percentage of the fair market value that is determined by local assessors to be the total taxable value of land and additions on the property. | Land | Improvement |
|---|---|---|---|---|
| 2025 | $1,041 | $53,160 | $0 | $0 |
| 2024 | $10 | $47,100 | $0 | $0 |
| 2023 | $979 | $33,780 | $0 | $0 |
| 2022 | $969 | $30,210 | $0 | $0 |
| 2021 | $949 | $28,540 | $0 | $0 |
| 2020 | $925 | $24,030 | $0 | $0 |
| 2019 | $902 | $21,640 | $0 | $0 |
| 2018 | $25 | $18,130 | $0 | $0 |
| 2017 | $877 | $17,750 | $2,900 | $14,850 |
| 2016 | $870 | $17,750 | $0 | $0 |
| 2015 | -- | $17,200 | $0 | $0 |
| 2012 | -- | $17,220 | $0 | $0 |
Source: Public Records
Map
Nearby Homes
- 8517 Essex Ave
- 8427 Timken Ave
- 8459 Timken Ave
- 8211 Standard
- 8276 Timken Ave
- 8291 Lozier Ave
- 8436 Lozier Ave
- 8653 Sterling St
- 8205 State Park
- 8734 Sterling St
- 8602 Kaltz St
- 8419 Paige Ave
- 8755 Sterling St
- 8087 Continental Ave
- 11028 Lozier Ave
- 11004 Republic Ave
- 7547 Stephens
- 8764 Kaltz Ave
- 11012 Republic Ave
- 11208 Stephens Rd
- 8436 Chapp Ave
- 8428 Chapp Ave
- 8452 Chapp Ave
- 8468 Chapp Ave
- 23736 Federal Ave
- 23750 Federal Ave
- 8476 Chapp Ave
- 8443 Jewett Ave
- 8435 Jewett Ave
- 23764 Federal Ave
- 23724 Federal Ave
- 8459 Jewett Ave
- 8427 Jewett Ave
- 23638 Federal Ave
- 8459 Chapp Ave
- 8435 Chapp Ave
- 8465 Jewett Ave
- 8480 Chapp Ave
- 8451 Jewett Ave
- 23630 Federal Ave
Your Personal Tour Guide
Ask me questions while you tour the home.