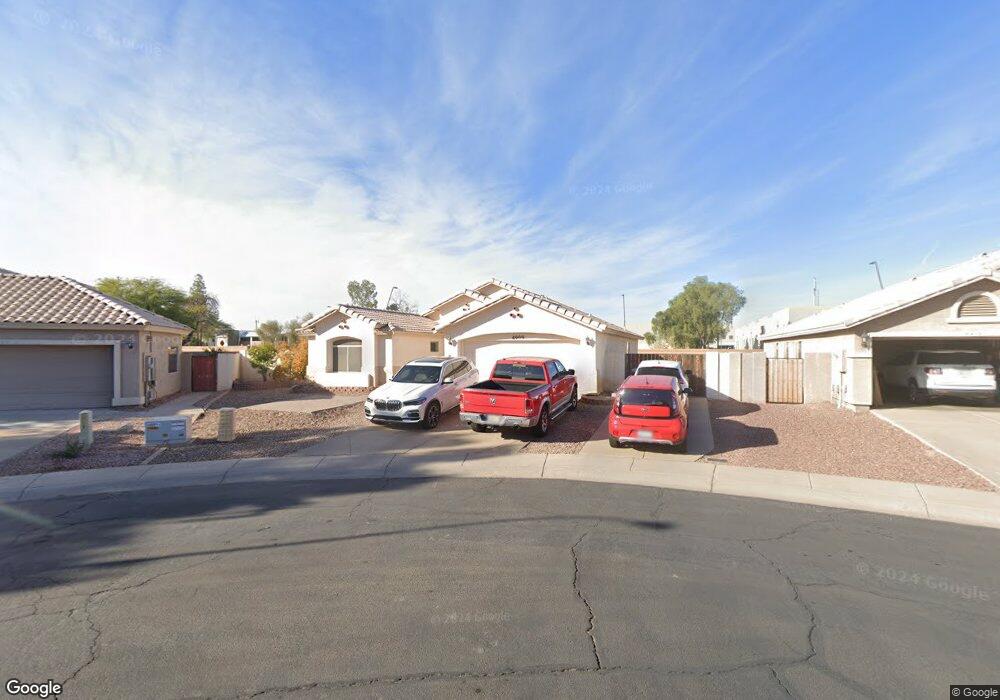
8444 S Stephanie Ln Tempe, AZ 85284
South Tempe NeighborhoodEstimated Value: $498,572 - $581,000
3
Beds
2
Baths
1,654
Sq Ft
$330/Sq Ft
Est. Value
About This Home
This home is located at 8444 S Stephanie Ln, Tempe, AZ 85284 and is currently estimated at $546,143, approximately $330 per square foot. 8444 S Stephanie Ln is a home located in Maricopa County with nearby schools including C I Waggoner School, Kyrene Middle School, and Mountain Pointe High School.
Ownership History
Date
Name
Owned For
Owner Type
Purchase Details
Closed on
Jun 28, 2005
Sold by
Baumhover Anthony S
Bought by
Robertson Jonathan and Robertson Jolene
Current Estimated Value
Home Financials for this Owner
Home Financials are based on the most recent Mortgage that was taken out on this home.
Original Mortgage
$325,000
Outstanding Balance
$169,544
Interest Rate
5.65%
Mortgage Type
New Conventional
Estimated Equity
$376,599
Purchase Details
Closed on
Jun 25, 2001
Sold by
Fernandez Samuel T
Bought by
Baumhover Anthony S
Home Financials for this Owner
Home Financials are based on the most recent Mortgage that was taken out on this home.
Original Mortgage
$169,847
Interest Rate
7.14%
Mortgage Type
VA
Purchase Details
Closed on
Jul 12, 1996
Sold by
Calex Homes Inc
Bought by
Fernandez Samuel T
Home Financials for this Owner
Home Financials are based on the most recent Mortgage that was taken out on this home.
Original Mortgage
$134,950
Interest Rate
8.3%
Mortgage Type
New Conventional
Create a Home Valuation Report for This Property
The Home Valuation Report is an in-depth analysis detailing your home's value as well as a comparison with similar homes in the area
Home Values in the Area
Average Home Value in this Area
Purchase History
| Date | Buyer | Sale Price | Title Company |
|---|---|---|---|
| Robertson Jonathan | $325,000 | Fidelity National Title Ins | |
| Baumhover Anthony S | $164,900 | Chicago Title Insurance Co | |
| Fernandez Samuel T | $142,101 | Security Title Agency |
Source: Public Records
Mortgage History
| Date | Status | Borrower | Loan Amount |
|---|---|---|---|
| Open | Robertson Jonathan | $325,000 | |
| Previous Owner | Baumhover Anthony S | $169,847 | |
| Previous Owner | Fernandez Samuel T | $134,950 |
Source: Public Records
Tax History Compared to Growth
Tax History
| Year | Tax Paid | Tax Assessment Tax Assessment Total Assessment is a certain percentage of the fair market value that is determined by local assessors to be the total taxable value of land and additions on the property. | Land | Improvement |
|---|---|---|---|---|
| 2025 | $3,016 | $27,656 | -- | -- |
| 2024 | $2,852 | $26,339 | -- | -- |
| 2023 | $2,852 | $38,650 | $7,730 | $30,920 |
| 2022 | $2,720 | $30,370 | $6,070 | $24,300 |
| 2021 | $2,780 | $29,060 | $5,810 | $23,250 |
| 2020 | $2,719 | $27,120 | $5,420 | $21,700 |
| 2019 | $2,638 | $25,670 | $5,130 | $20,540 |
| 2018 | $2,558 | $23,920 | $4,780 | $19,140 |
| 2017 | $2,460 | $22,470 | $4,490 | $17,980 |
| 2016 | $2,482 | $22,300 | $4,460 | $17,840 |
| 2015 | $2,289 | $19,980 | $3,990 | $15,990 |
Source: Public Records
Map
Nearby Homes
- 431 W Calle de Caballos
- 8274 S Stephanie Ln
- 386 W Pecan Place
- 269 W El Freda Rd
- 8578 S Maple Ave
- 8438 S Maple Ave
- 437 W Verde Ln
- 8382 S Mill Ave
- 62 W Secretariat Dr
- 91 W Calle de Arcos
- 9011 S Dateland Dr
- 7854 S Dateland Dr
- 8272 S Pecan Grove Cir
- 8276 S Pecan Grove Cir
- 42 W La Vieve Ln
- 8938 S Forest Ave
- 260 E Rhea Rd
- 311 W Jeanine Dr Unit 2
- 11812 S 71st St
- 61 E Dawn Dr
- 451 W Palomino Dr
- 8438 S Stephanie Ln
- 439 W Palomino Dr
- 486 W Colt Rd
- 440 W Palomino Dr
- 427 W Palomino Dr
- 478 W Colt Rd
- 8432 S Stephanie Ln
- 428 W Palomino Dr
- 441 W El Freda Rd
- 470 W Colt Rd
- 415 W Palomino Dr
- 8426 S Stephanie Ln
- 416 W Palomino Dr
- 462 W Colt Rd
- 8420 S Stephanie Ln
- 429 W El Freda Rd
- 8474 S Stephanie Ln
- 403 W Palomino Dr
- 454 W Colt Rd Unit !WOW!