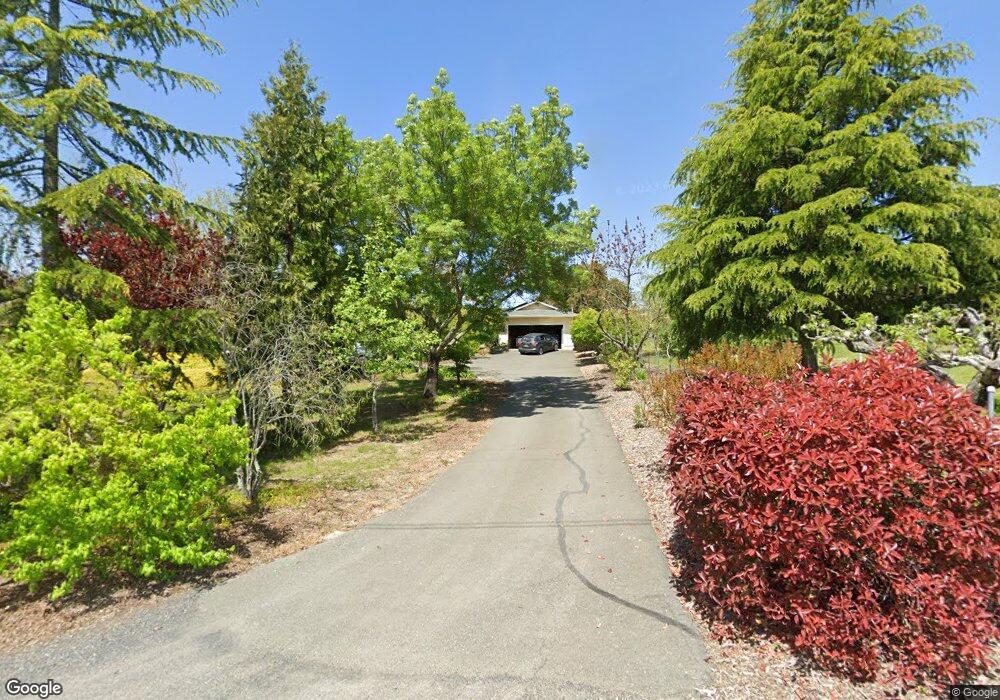
8446 Appleseed Way Sebastopol, CA 95472
Estimated Value: $1,163,645 - $1,492,000
3
Beds
2
Baths
1,665
Sq Ft
$780/Sq Ft
Est. Value
About This Home
This home is located at 8446 Appleseed Way, Sebastopol, CA 95472 and is currently estimated at $1,298,661, approximately $779 per square foot. 8446 Appleseed Way is a home located in Sonoma County with nearby schools including Apple Blossom School, Analy High School, and Sunridge Charter School.
Ownership History
Date
Name
Owned For
Owner Type
Purchase Details
Closed on
Mar 24, 2012
Sold by
Wrisley Gregg T and Brandes Jessica
Bought by
Wrisley Gregg T and Brandes Jessica
Current Estimated Value
Home Financials for this Owner
Home Financials are based on the most recent Mortgage that was taken out on this home.
Original Mortgage
$126,500
Outstanding Balance
$82,124
Interest Rate
2.75%
Mortgage Type
Adjustable Rate Mortgage/ARM
Estimated Equity
$1,216,537
Purchase Details
Closed on
Feb 15, 2006
Sold by
Wrisley Gregg and Brandes Jessica
Bought by
Wrisley Gregg T and Brandes Jessica
Purchase Details
Closed on
Aug 19, 1998
Sold by
Sieber Dorothea A
Bought by
Wrisley Gregg and Brandes Jessica
Home Financials for this Owner
Home Financials are based on the most recent Mortgage that was taken out on this home.
Original Mortgage
$179,000
Interest Rate
6.88%
Purchase Details
Closed on
Apr 24, 1991
Sold by
Rajeski Richard A
Bought by
Sieber Dorothea
Create a Home Valuation Report for This Property
The Home Valuation Report is an in-depth analysis detailing your home's value as well as a comparison with similar homes in the area
Home Values in the Area
Average Home Value in this Area
Purchase History
| Date | Buyer | Sale Price | Title Company |
|---|---|---|---|
| Wrisley Gregg T | -- | Placer Title Company | |
| Wrisley Gregg T | -- | Placer Title Company | |
| Wrisley Gregg T | -- | None Available | |
| Wrisley Gregg | $276,000 | Old Republic Title Company | |
| Sieber Dorothea | -- | -- |
Source: Public Records
Mortgage History
| Date | Status | Borrower | Loan Amount |
|---|---|---|---|
| Open | Wrisley Gregg T | $126,500 | |
| Previous Owner | Wrisley Gregg | $179,000 |
Source: Public Records
Tax History Compared to Growth
Tax History
| Year | Tax Paid | Tax Assessment Tax Assessment Total Assessment is a certain percentage of the fair market value that is determined by local assessors to be the total taxable value of land and additions on the property. | Land | Improvement |
|---|---|---|---|---|
| 2025 | $5,181 | $432,678 | $235,152 | $197,526 |
| 2024 | $5,181 | $424,195 | $230,542 | $193,653 |
| 2023 | $5,181 | $415,878 | $226,022 | $189,856 |
| 2022 | $4,937 | $407,725 | $221,591 | $186,134 |
| 2021 | $4,846 | $399,732 | $217,247 | $182,485 |
| 2020 | $4,889 | $395,634 | $215,020 | $180,614 |
| 2019 | $4,577 | $387,877 | $210,804 | $177,073 |
| 2018 | $4,504 | $380,272 | $206,671 | $173,601 |
| 2017 | $4,310 | $372,817 | $202,619 | $170,198 |
| 2016 | $4,236 | $365,508 | $198,647 | $166,861 |
| 2015 | $4,099 | $360,019 | $195,664 | $164,355 |
| 2014 | $4,018 | $352,968 | $191,832 | $161,136 |
Source: Public Records
Map
Nearby Homes
- 8061 Elphick Rd
- 2485 Sanders Rd
- 7739 Lynch Rd
- 1850 Blucher Valley Rd
- 975 Via Della Rosa
- 7580 Meadowlark Dr
- 447 Sparkes Rd
- 7251 Fircrest Ave
- 712 Bloomfield Rd
- 1171 Gravenstein Hwy S
- 830 Litchfield Ave
- 6917 Redwood Ave
- 1415 Schaeffer Rd
- 6781 Evergreen Ave
- 5301 Gravenstein Hwy S
- 1466 Cooper Rd
- 105 Virginia Ave Unit 3
- 7600 Bodega Ave
- 451 S High St
- 7720 Bodega Ave Unit 3
- 8430 Appleseed Way
- 8460 Appleseed Way
- 2051 Pleasant Hill Rd
- 2053 Pleasant Hill Rd
- 8414 Appleseed Way
- 2061 Pleasant Hill Rd
- 8400 Appleseed Way
- 8343 Cleveland Ave
- 2105 Pleasant Hill Rd
- 2195 Pleasant Hill Rd
- 2021 Archer Way
- 2045 Pleasant Hill Rd
- 1689 Elphick Rd
- 2039 Pleasant Hill Rd
- 2206 Pleasant Hill Rd
- 2202 Pleasant Hill Rd
- 1979 Archer Way
- 2003 Pleasant Hill Rd
- 1967 Pleasant Hill Rd
- 2000 Pleasant Hill Rd