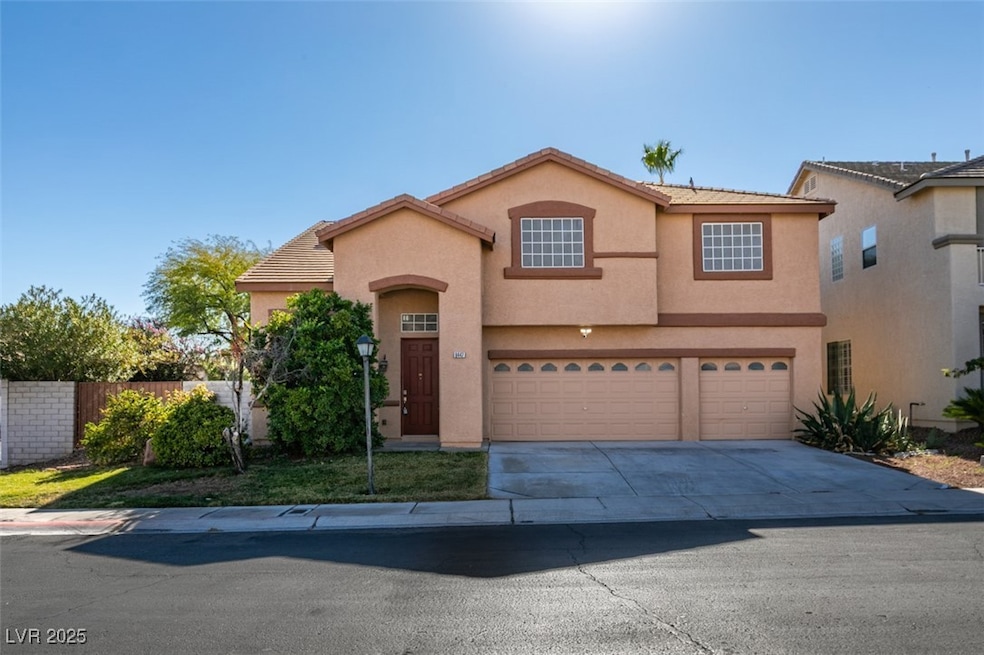
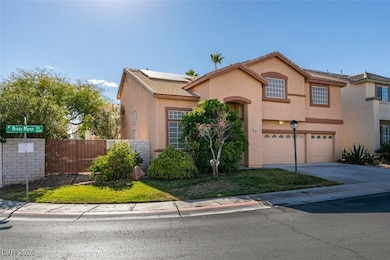

$3,150
- 3 Beds
- 2.5 Baths
- 2,494 Sq Ft
- 10973 Krista Leigh Ave
- Mountain Springs, NV
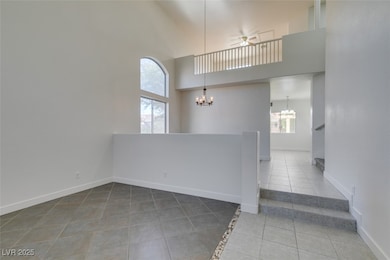
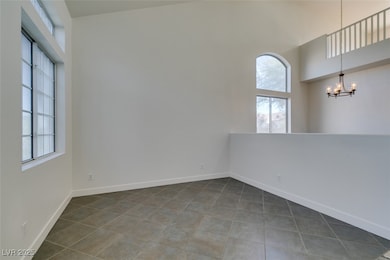
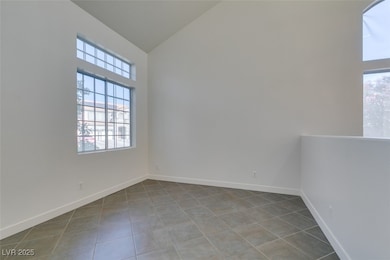
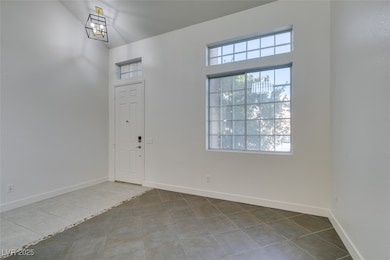
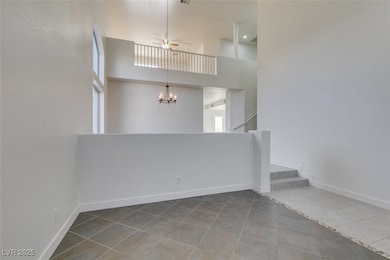
BREATHTAKING, IMMACULATE, STUNNING. THIS IS ONE OF THE MOST UPSCALE AND THOUGHTFULLY DESIGNED HOME YOU WILL HAVE THE OPPORTUNITY TO LEASE IN THE LAS VEGAS VALLEY. DESIGNER CHEF'S KITCHEN WITH CUSTOM NAVY BLUE CABINETS, PENDANT LIGHTS, QUARTZ COUNTERS, UPGRADED RANGE WITH OVEN, WALL OVEN WITH SEPARATE MICROWAVE, WALK-IN PANTRY, AND HIGH CEILINGS. THE GREAT ROOM IS LARGE AND OPEN WITH ELECTRIC
Geoffrey Lavell THE Brokerage A RE Firm