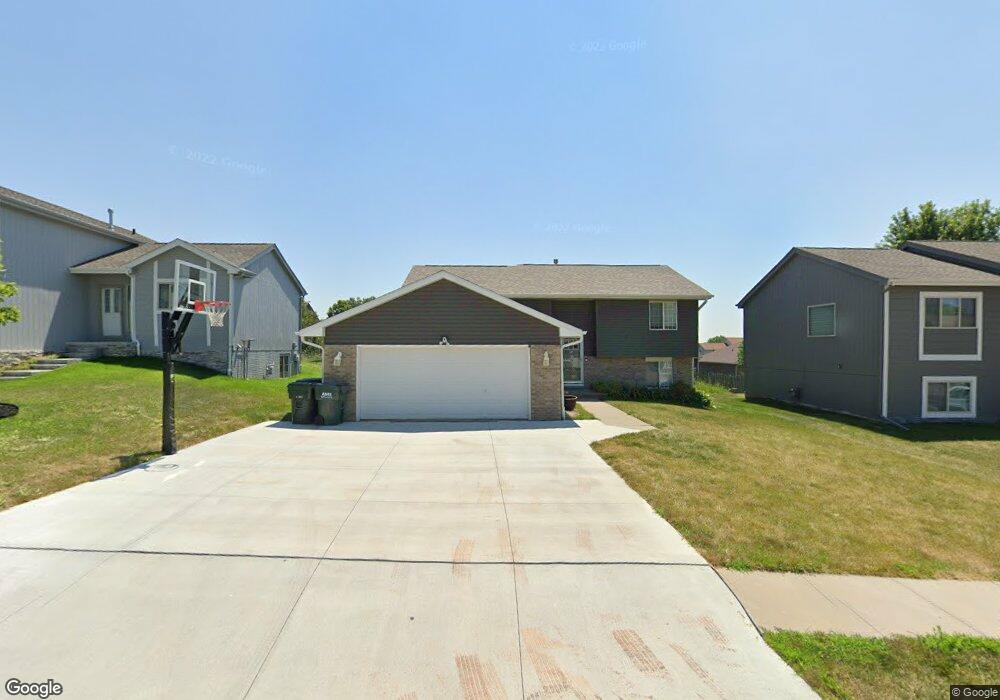
8449 Baker St Omaha, NE 68122
North Central Omaha NeighborhoodEstimated Value: $273,380 - $298,000
2
Beds
3
Baths
1,074
Sq Ft
$268/Sq Ft
Est. Value
About This Home
This home is located at 8449 Baker St, Omaha, NE 68122 and is currently estimated at $287,845, approximately $268 per square foot. 8449 Baker St is a home located in Douglas County with nearby schools including Springville Elementary School, Nathan Hale Magnet Middle School, and Northwest High School.
Ownership History
Date
Name
Owned For
Owner Type
Purchase Details
Closed on
Apr 11, 2019
Sold by
Harrison Senecca J and Harrison Patricia G
Bought by
Harrison Seneca J and Harrison Patricia G
Current Estimated Value
Home Financials for this Owner
Home Financials are based on the most recent Mortgage that was taken out on this home.
Original Mortgage
$152,000
Outstanding Balance
$133,904
Interest Rate
4.4%
Mortgage Type
New Conventional
Estimated Equity
$153,941
Purchase Details
Closed on
Feb 3, 2005
Sold by
Home Enterprises Inc
Bought by
Harrison Seneca J
Create a Home Valuation Report for This Property
The Home Valuation Report is an in-depth analysis detailing your home's value as well as a comparison with similar homes in the area
Home Values in the Area
Average Home Value in this Area
Purchase History
| Date | Buyer | Sale Price | Title Company |
|---|---|---|---|
| Harrison Seneca J | -- | None Available | |
| Harrison Seneca J | $152,500 | -- |
Source: Public Records
Mortgage History
| Date | Status | Borrower | Loan Amount |
|---|---|---|---|
| Open | Harrison Seneca J | $152,000 |
Source: Public Records
Tax History Compared to Growth
Tax History
| Year | Tax Paid | Tax Assessment Tax Assessment Total Assessment is a certain percentage of the fair market value that is determined by local assessors to be the total taxable value of land and additions on the property. | Land | Improvement |
|---|---|---|---|---|
| 2024 | $4,500 | $254,100 | $19,000 | $235,100 |
| 2023 | $4,500 | $200,200 | $19,000 | $181,200 |
| 2022 | $4,582 | $200,200 | $19,000 | $181,200 |
| 2021 | $3,918 | $171,000 | $19,000 | $152,000 |
| 2020 | $4,296 | $171,000 | $19,000 | $152,000 |
| 2019 | $4,429 | $171,000 | $19,000 | $152,000 |
| 2018 | $4,101 | $158,100 | $19,000 | $139,100 |
| 2017 | $3,760 | $143,500 | $19,000 | $124,500 |
| 2016 | $3,293 | $126,000 | $19,000 | $107,000 |
| 2015 | $3,236 | $126,000 | $19,000 | $107,000 |
| 2014 | $3,236 | $126,000 | $19,000 | $107,000 |
Source: Public Records
Map
Nearby Homes