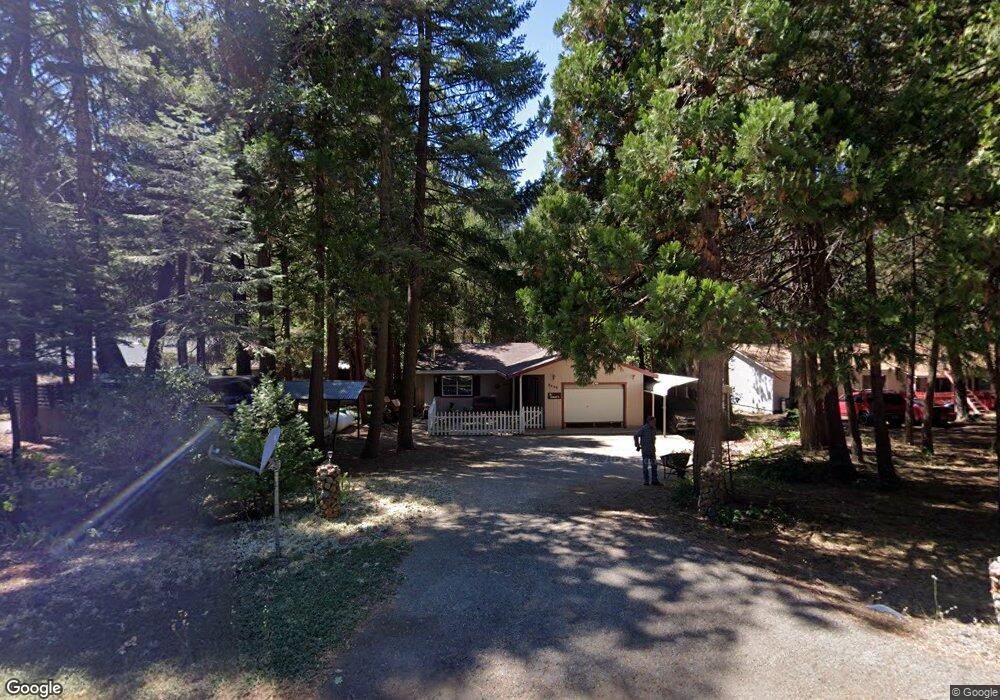
8449 Starlite Pines Rd Shingletown, CA 96088
Shingletown NeighborhoodEstimated Value: $195,000 - $237,096
3
Beds
1
Bath
1,050
Sq Ft
$212/Sq Ft
Est. Value
About This Home
This home is located at 8449 Starlite Pines Rd, Shingletown, CA 96088 and is currently estimated at $223,024, approximately $212 per square foot. 8449 Starlite Pines Rd is a home located in Shasta County with nearby schools including Black Butte Elementary School, Black Butte Junior High School, and Foothill High School.
Ownership History
Date
Name
Owned For
Owner Type
Purchase Details
Closed on
Oct 22, 2002
Sold by
Bunting Archiebald L
Bought by
Hebert Richard R and Hebert Julie E
Current Estimated Value
Home Financials for this Owner
Home Financials are based on the most recent Mortgage that was taken out on this home.
Original Mortgage
$80,000
Outstanding Balance
$33,368
Interest Rate
6.09%
Estimated Equity
$189,656
Purchase Details
Closed on
Jul 6, 2000
Sold by
Rural Housing Service
Bought by
Bunting Archiebald L
Home Financials for this Owner
Home Financials are based on the most recent Mortgage that was taken out on this home.
Original Mortgage
$74,100
Interest Rate
8.19%
Mortgage Type
Seller Take Back
Purchase Details
Closed on
Feb 15, 2000
Sold by
Kelly Laurie S
Bought by
Rural Housing Service
Create a Home Valuation Report for This Property
The Home Valuation Report is an in-depth analysis detailing your home's value as well as a comparison with similar homes in the area
Home Values in the Area
Average Home Value in this Area
Purchase History
| Date | Buyer | Sale Price | Title Company |
|---|---|---|---|
| Hebert Richard R | $115,000 | First American Title Co | |
| Bunting Archiebald L | $74,500 | Alliance Title | |
| Rural Housing Service | $58,405 | Chicago Title |
Source: Public Records
Mortgage History
| Date | Status | Borrower | Loan Amount |
|---|---|---|---|
| Open | Hebert Richard R | $80,000 | |
| Previous Owner | Bunting Archiebald L | $74,100 |
Source: Public Records
Tax History Compared to Growth
Tax History
| Year | Tax Paid | Tax Assessment Tax Assessment Total Assessment is a certain percentage of the fair market value that is determined by local assessors to be the total taxable value of land and additions on the property. | Land | Improvement |
|---|---|---|---|---|
| 2025 | $1,715 | $166,533 | $28,956 | $137,577 |
| 2024 | $1,685 | $163,269 | $28,389 | $134,880 |
| 2023 | $1,685 | $160,069 | $27,833 | $132,236 |
| 2022 | $1,644 | $156,932 | $27,288 | $129,644 |
| 2021 | $1,591 | $153,855 | $26,753 | $127,102 |
| 2020 | $1,617 | $152,278 | $26,479 | $125,799 |
| 2019 | $1,570 | $149,293 | $25,960 | $123,333 |
| 2018 | $1,552 | $146,366 | $25,451 | $120,915 |
| 2017 | $1,543 | $143,497 | $24,952 | $118,545 |
| 2016 | $1,343 | $130,000 | $30,000 | $100,000 |
| 2015 | $1,255 | $125,000 | $30,000 | $95,000 |
| 2014 | $1,108 | $110,000 | $30,000 | $80,000 |
Source: Public Records
Map
Nearby Homes
- 8238 Starlite Pines Rd
- 0 Aurora View Dr
- 004 Ritts Mill Rd
- 002 Ritts Mill Rd
- 001 Ritts Mill Rd
- 0 Emigrant Trail Unit 25-3325
- 7693 Linda Rd
- Lot # 67 La Jolla Way
- 7652 Eastwood Way
- 0 Linda Rd
- 2.5 acres Sky Tree Ln
- 0 Hidden Meadows Rd
- 33103 Michelle Ln
- Lot 13 Speargrass Ct
- Lot 12 Speargrass Ct
- Lot 34 Princess Pine
- Lot 27 Princess Pine
- 32711 Twin Pines Dr
- Lot 9 Princess Pine Place
- Lot 8 Princess Pine Place
- 8441 Starlite Pines Rd
- 8457 Starlite Pines Rd
- Spring Rain California 44
- 8435 Starlight
- 8465 Starlite Pines Rd
- 8448 Starlite Pines Rd
- 8473 Starlite Pines Rd
- 8427 Starlite Pines Rd
- 8436 Starlite Pines Rd
- 33601 Short Rainbow Ln
- 8481 Starlite Pines Rd
- 8442 Starlite Pines Rd
- 8442 Starlite Pines Rd
- 8470 Starlite Pines Rd
- 8199 Amberwoods Place
- 8428 Starlite Pines Rd
- 8163 Amberwoods Place
- 8163 Amberwoods Place
- 33620 Short Rainbow Ln
- 8482 Starlite Pines Rd