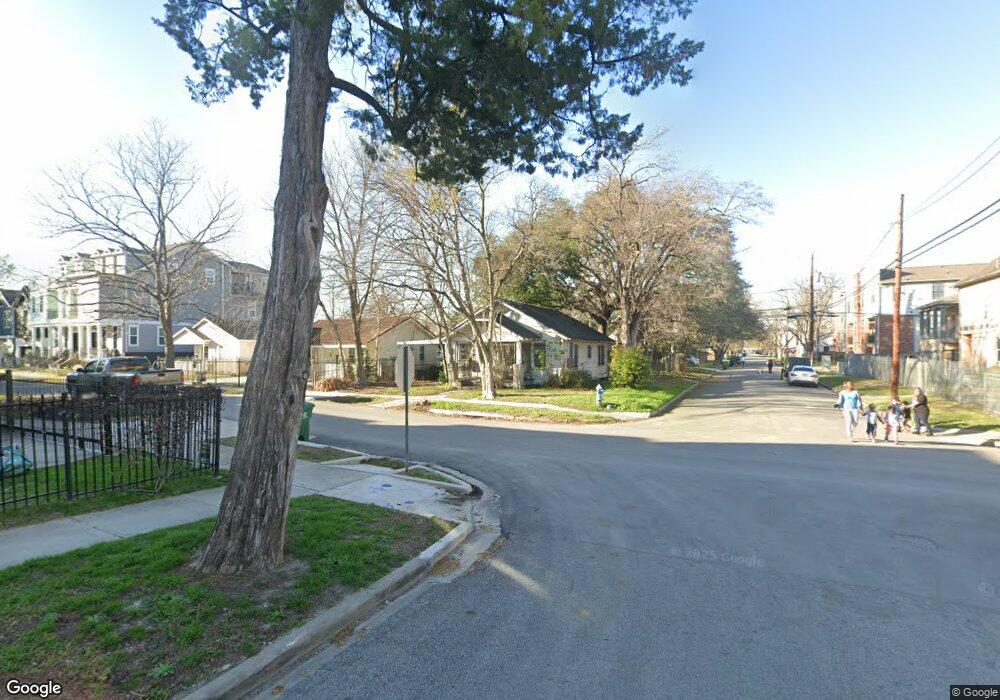
845 E 26th St Houston, TX 77009
Greater Heights NeighborhoodEstimated Value: $444,000 - $532,000
2
Beds
1
Bath
884
Sq Ft
$548/Sq Ft
Est. Value
About This Home
This home is located at 845 E 26th St, Houston, TX 77009 and is currently estimated at $484,146, approximately $547 per square foot. 845 E 26th St is a home located in Harris County with nearby schools including Field Elementary School, Hamilton Middle, and Heights High School.
Ownership History
Date
Name
Owned For
Owner Type
Purchase Details
Closed on
Feb 24, 2025
Sold by
Gold Coast Equity Llc
Bought by
Tomo Development Llc
Current Estimated Value
Purchase Details
Closed on
Oct 22, 2024
Sold by
Taylor Geraldine
Bought by
Gerlich Gilbert
Purchase Details
Closed on
Oct 11, 2024
Sold by
Taylor Geraldine
Bought by
Gerlich Gilbert
Create a Home Valuation Report for This Property
The Home Valuation Report is an in-depth analysis detailing your home's value as well as a comparison with similar homes in the area
Home Values in the Area
Average Home Value in this Area
Purchase History
| Date | Buyer | Sale Price | Title Company |
|---|---|---|---|
| Tomo Development Llc | -- | Fidelity National Title | |
| Gold Coast Equity Llc | -- | Fidelity National Title | |
| Gerlich Gilbert | -- | None Listed On Document | |
| Gerlich Gilbert | -- | None Listed On Document | |
| Gerlich Gilbert | -- | None Listed On Document | |
| Gerlich Gilbert | -- | None Listed On Document |
Source: Public Records
Tax History Compared to Growth
Tax History
| Year | Tax Paid | Tax Assessment Tax Assessment Total Assessment is a certain percentage of the fair market value that is determined by local assessors to be the total taxable value of land and additions on the property. | Land | Improvement |
|---|---|---|---|---|
| 2025 | $9,330 | $478,120 | $450,000 | $28,120 |
| 2024 | $9,330 | $445,929 | $420,000 | $25,929 |
| 2023 | $9,330 | $445,929 | $420,000 | $25,929 |
| 2022 | $8,423 | $382,538 | $360,000 | $22,538 |
| 2021 | $7,277 | $312,245 | $288,000 | $24,245 |
| 2020 | $7,524 | $310,711 | $288,000 | $22,711 |
| 2019 | $7,811 | $308,674 | $288,000 | $20,674 |
| 2018 | $7,335 | $289,887 | $270,000 | $19,887 |
| 2017 | $7,330 | $289,887 | $270,000 | $19,887 |
| 2016 | $6,668 | $263,716 | $240,000 | $23,716 |
| 2015 | $5,110 | $263,716 | $240,000 | $23,716 |
| 2014 | $5,110 | $198,763 | $180,000 | $18,763 |
Source: Public Records
Map
Nearby Homes