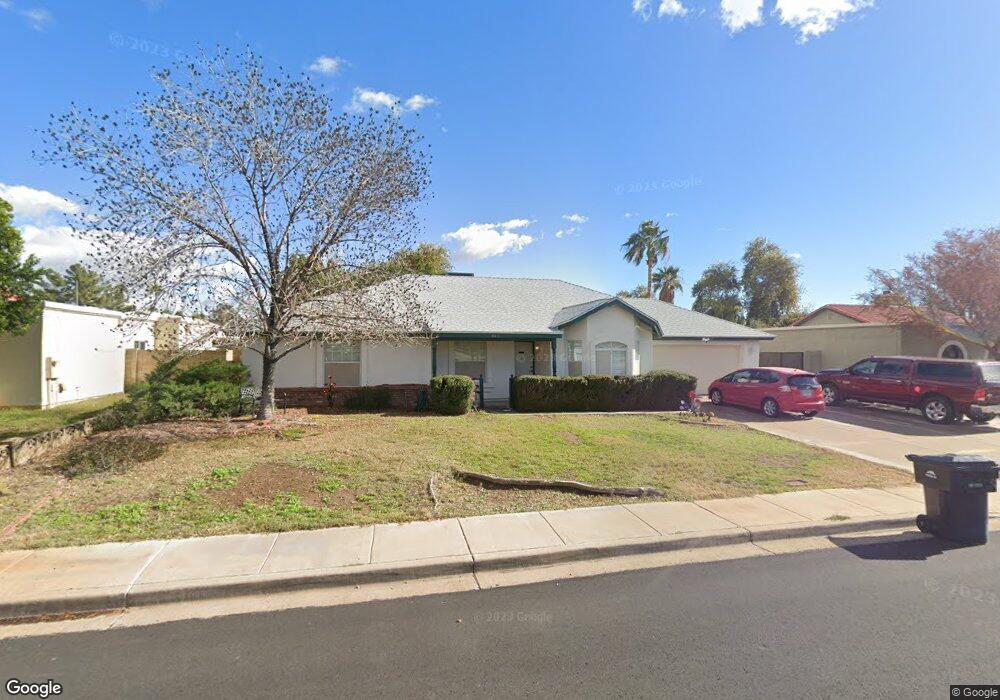
845 N Yale Mesa, AZ 85213
North Central Mesa NeighborhoodEstimated Value: $426,040 - $520,000
--
Bed
2
Baths
1,787
Sq Ft
$274/Sq Ft
Est. Value
About This Home
This home is located at 845 N Yale, Mesa, AZ 85213 and is currently estimated at $489,010, approximately $273 per square foot. 845 N Yale is a home located in Maricopa County with nearby schools including Field Elementary School, Franklin at Brimhall Elementary School, and Franklin West Elementary School.
Ownership History
Date
Name
Owned For
Owner Type
Purchase Details
Closed on
Mar 10, 2014
Sold by
Earhart Gregory and Earhart Ann L
Bought by
Earhart Gregory
Current Estimated Value
Home Financials for this Owner
Home Financials are based on the most recent Mortgage that was taken out on this home.
Original Mortgage
$114,350
Outstanding Balance
$60,641
Interest Rate
4.29%
Mortgage Type
New Conventional
Estimated Equity
$428,369
Purchase Details
Closed on
Mar 14, 2002
Sold by
Fine Kevin P and Fine Candice W
Bought by
Earhart Gregory and Earhart Ann L
Home Financials for this Owner
Home Financials are based on the most recent Mortgage that was taken out on this home.
Original Mortgage
$128,000
Interest Rate
6.87%
Mortgage Type
New Conventional
Purchase Details
Closed on
Sep 1, 1999
Sold by
Fine Kevin P and Fine Candice W
Bought by
Fine Kevin P and Fine Candice W
Purchase Details
Closed on
May 15, 1995
Sold by
Hakes Kim C and Hakes Lisa D
Bought by
Fine Kevin and Fine Candice
Purchase Details
Closed on
Aug 12, 1994
Sold by
Irey Leo E
Bought by
Hakes Kim C and Hakes Lisa D
Create a Home Valuation Report for This Property
The Home Valuation Report is an in-depth analysis detailing your home's value as well as a comparison with similar homes in the area
Home Values in the Area
Average Home Value in this Area
Purchase History
| Date | Buyer | Sale Price | Title Company |
|---|---|---|---|
| Earhart Gregory | -- | None Available | |
| Earhart Gregory | $160,000 | First American Title | |
| Fine Kevin P | -- | -- | |
| Fine Kevin | $111,400 | Transamerica Title Ins Co | |
| Hakes Kim C | $30,000 | Transamerica Title Ins Co |
Source: Public Records
Mortgage History
| Date | Status | Borrower | Loan Amount |
|---|---|---|---|
| Open | Earhart Gregory | $114,350 | |
| Closed | Earhart Gregory | $128,000 |
Source: Public Records
Tax History Compared to Growth
Tax History
| Year | Tax Paid | Tax Assessment Tax Assessment Total Assessment is a certain percentage of the fair market value that is determined by local assessors to be the total taxable value of land and additions on the property. | Land | Improvement |
|---|---|---|---|---|
| 2025 | $1,964 | $23,649 | -- | -- |
| 2024 | $1,985 | $22,523 | -- | -- |
| 2023 | $1,985 | $33,850 | $6,770 | $27,080 |
| 2022 | $1,942 | $28,050 | $5,610 | $22,440 |
| 2021 | $1,995 | $26,110 | $5,220 | $20,890 |
| 2020 | $1,968 | $23,670 | $4,730 | $18,940 |
| 2019 | $1,824 | $22,120 | $4,420 | $17,700 |
| 2018 | $1,741 | $20,350 | $4,070 | $16,280 |
| 2017 | $1,686 | $20,100 | $4,020 | $16,080 |
| 2016 | $1,656 | $19,100 | $3,820 | $15,280 |
| 2015 | $1,563 | $18,110 | $3,620 | $14,490 |
Source: Public Records
Map
Nearby Homes
- 2548 E Encanto St
- 857 N Gaylord Cir
- 2560 E Fairfield St
- 2450 E Adobe St
- 2534 E Fairfield St
- 721 N 25th St
- 2435 E Evergreen St
- 645 N Windsor
- 2433 E Enrose St
- 2407 E Encanto St
- 2322 E Evergreen St
- 3020 E Des Moines St
- 2301 E Enrose St
- 2830 E Brown Rd Unit 10
- 2607 E Camino St
- 2253 E Encanto St
- 2353 E Brown Rd
- 2252 E Dartmouth St
- 3046 E Dover St
- 2610 E University Dr
- 835 N Yale
- 851 N Yale
- 2651 E Enrose St
- 842 N York Cir
- 825 N Yale
- 834 N York Cir
- 2655 E Enrose St
- 824 N York Cir
- 2640 E Enrose St
- 2623 E Enrose St
- 2646 E Enrose St
- 819 N Yale
- 2634 E Enrose St
- 2667 E Enrose St
- 2652 E Enrose St
- 2624 E Enrose St
- 841 N York Cir
- 818 N York Cir
- 2617 E Enrose St
- 2656 E Enrose St