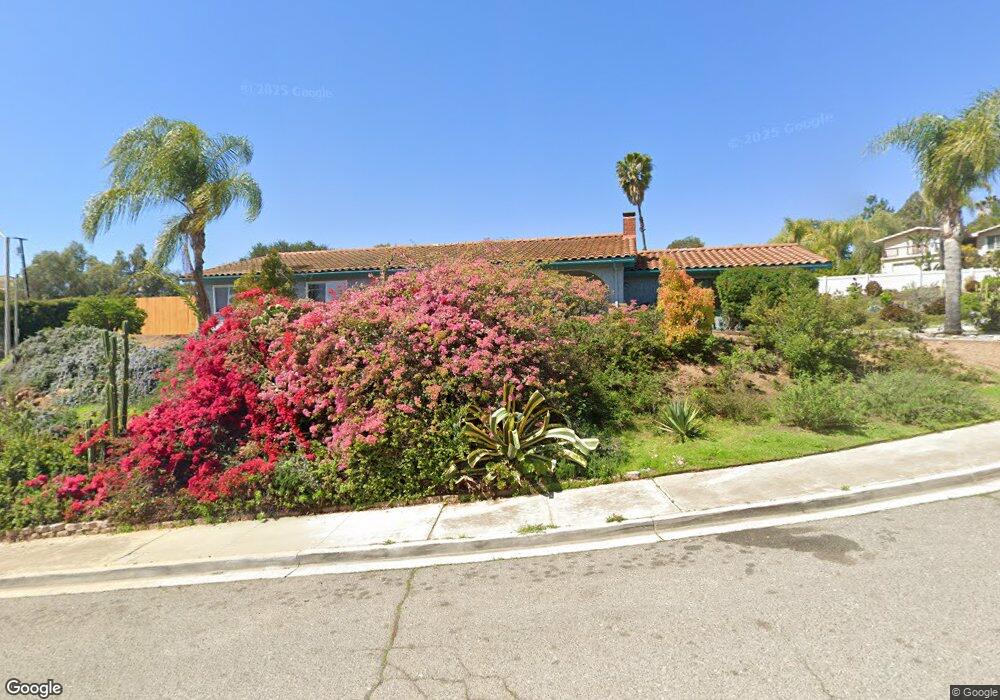
845 Pinecrest St Escondido, CA 92025
Central Escondido NeighborhoodEstimated Value: $857,135 - $961,000
3
Beds
2
Baths
1,728
Sq Ft
$525/Sq Ft
Est. Value
About This Home
This home is located at 845 Pinecrest St, Escondido, CA 92025 and is currently estimated at $906,534, approximately $524 per square foot. 845 Pinecrest St is a home located in San Diego County with nearby schools including Felicita Elementary, Del Dios Academy of Arts & Sciences, and San Pasqual High School.
Ownership History
Date
Name
Owned For
Owner Type
Purchase Details
Closed on
Dec 12, 2019
Sold by
Decker Margaret Sharp
Bought by
Decker Margaret Sharp and The Margaret Decker Trust
Current Estimated Value
Purchase Details
Closed on
Feb 27, 2013
Sold by
Decker Margaret
Bought by
Decker Margaret Sharp
Purchase Details
Closed on
Jun 6, 2012
Sold by
Richardson Corey
Bought by
Decker Margaret
Home Financials for this Owner
Home Financials are based on the most recent Mortgage that was taken out on this home.
Original Mortgage
$282,400
Outstanding Balance
$194,515
Interest Rate
3.7%
Mortgage Type
New Conventional
Estimated Equity
$712,019
Purchase Details
Closed on
Mar 18, 2009
Sold by
Vanschyndel C Richard
Bought by
Richardson Corey
Home Financials for this Owner
Home Financials are based on the most recent Mortgage that was taken out on this home.
Original Mortgage
$230,040
Interest Rate
5.17%
Mortgage Type
VA
Purchase Details
Closed on
Nov 10, 1993
Sold by
Uggla Helen J
Bought by
Uggla Helen J
Purchase Details
Closed on
Sep 26, 1983
Create a Home Valuation Report for This Property
The Home Valuation Report is an in-depth analysis detailing your home's value as well as a comparison with similar homes in the area
Home Values in the Area
Average Home Value in this Area
Purchase History
| Date | Buyer | Sale Price | Title Company |
|---|---|---|---|
| Decker Margaret Sharp | -- | None Available | |
| Decker Margaret Sharp | -- | None Available | |
| Decker Margaret Sharp | -- | None Available | |
| Decker Margaret | $353,000 | First American Title | |
| Richardson Corey | $284,000 | Fidelity National Title San | |
| Uggla Helen J | -- | -- | |
| -- | $130,000 | -- |
Source: Public Records
Mortgage History
| Date | Status | Borrower | Loan Amount |
|---|---|---|---|
| Open | Decker Margaret | $282,400 | |
| Previous Owner | Richardson Corey | $230,040 |
Source: Public Records
Tax History
| Year | Tax Paid | Tax Assessment Tax Assessment Total Assessment is a certain percentage of the fair market value that is determined by local assessors to be the total taxable value of land and additions on the property. | Land | Improvement |
|---|---|---|---|---|
| 2025 | $9,443 | $434,681 | $314,008 | $120,673 |
| 2024 | $9,443 | $426,158 | $307,851 | $118,307 |
| 2023 | $9,332 | $417,803 | $301,815 | $115,988 |
| 2022 | $9,281 | $409,612 | $295,898 | $113,714 |
| 2021 | $9,154 | $401,582 | $290,097 | $111,485 |
| 2020 | $6,513 | $397,465 | $287,123 | $110,342 |
| 2019 | $6,401 | $389,673 | $281,494 | $108,179 |
| 2018 | $6,272 | $382,033 | $275,975 | $106,058 |
| 2017 | $40 | $374,543 | $270,564 | $103,979 |
| 2016 | $6,099 | $367,200 | $265,259 | $101,941 |
| 2015 | $4,120 | $361,685 | $261,275 | $100,410 |
| 2014 | $3,948 | $354,601 | $256,157 | $98,444 |
Source: Public Records
Map
Nearby Homes
- 1564 Tanglewood Ln Unit 18
- 1305 Kiso Glen
- 752 W 9th Ave
- 1369 W 11th Ave
- 581585 Montview Dr
- 1603 Towell Ln
- 101 S Spruce St Unit 232
- 120 N Upas St
- 1941 Estancia Place
- 1575 W Valley Pkwy Unit 25
- 1305 Scenic Dr
- 1670 Amanda Ln
- 1361 N Amanda Glen N
- 1381 Amanda Glen N
- 1391 Amanda Ln
- 1390 Amanda Glen Ln N
- 1674 W 11th Ave
- 222 W 8th Ave
- 211 W 9th Ave
- 1670 Amanda Glen
- 839 Pinecrest St
- 850 Pinecrest St
- 1050 W 9th Ave
- 840 Pinecrest St
- 830 Pinecrest St
- 901 Pinecrest Ave
- 1125 S Pine St
- 820 Pinecrest St
- 835 Pinecrest St
- 825 Pinecrest St
- 1060 W 9th Ave
- 1010 W 9th Ave
- 815 S Upas St
- 755 S Upas St
- 805 Pinecrest St
- 911 Pinecrest Ave
- 835 S Quince St
- 835 S Upas St
- 735 S Upas St
- 1070 W 9th Ave
Your Personal Tour Guide
Ask me questions while you tour the home.