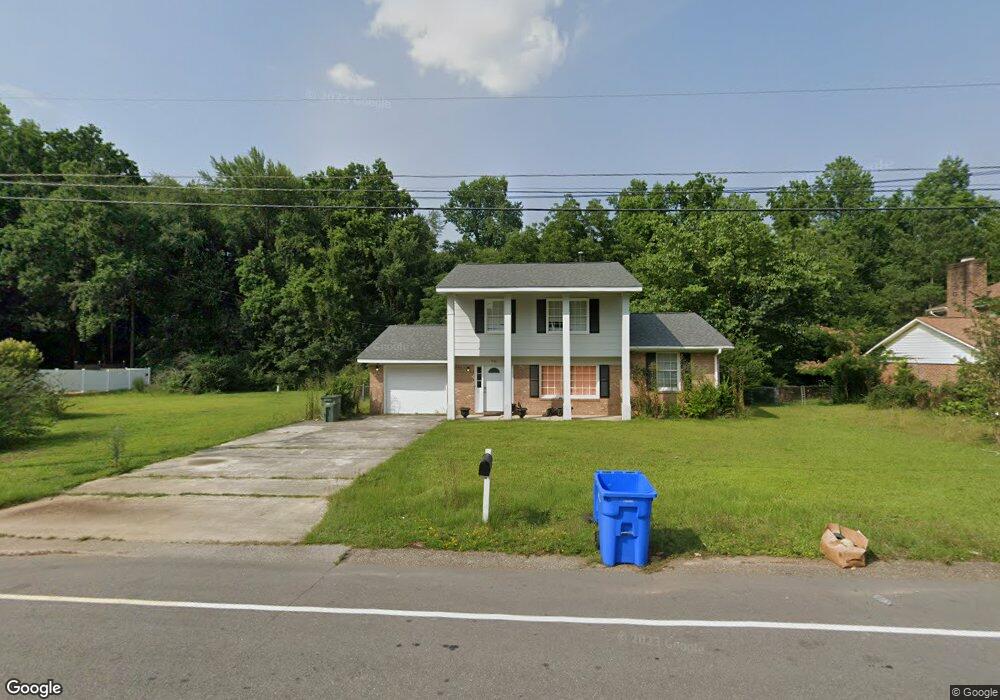
845 Stoneykirk Dr Fayetteville, NC 28314
Douglas Byrd NeighborhoodEstimated Value: $203,000 - $221,000
3
Beds
3
Baths
1,698
Sq Ft
$127/Sq Ft
Est. Value
About This Home
This home is located at 845 Stoneykirk Dr, Fayetteville, NC 28314 and is currently estimated at $215,527, approximately $126 per square foot. 845 Stoneykirk Dr is a home located in Cumberland County with nearby schools including Montclair Elementary, Douglas Byrd High School, and Fayetteville Christian School.
Ownership History
Date
Name
Owned For
Owner Type
Purchase Details
Closed on
Aug 18, 2022
Sold by
Lin and Xianyi
Bought by
Wesson Donovan and Wesson Elizabeth
Current Estimated Value
Home Financials for this Owner
Home Financials are based on the most recent Mortgage that was taken out on this home.
Original Mortgage
$173,821
Outstanding Balance
$166,182
Interest Rate
5.51%
Mortgage Type
VA
Estimated Equity
$49,345
Purchase Details
Closed on
Dec 19, 2018
Sold by
Yang Xueling
Bought by
Wang Xianyi and Lin Qianmin
Purchase Details
Closed on
Feb 29, 2016
Sold by
Whiteside Sonja C and Whiteside Frank R
Bought by
Yang Xueling
Purchase Details
Closed on
May 3, 2002
Sold by
Toman Edward L
Bought by
Hawkins Sonja J
Home Financials for this Owner
Home Financials are based on the most recent Mortgage that was taken out on this home.
Original Mortgage
$89,000
Interest Rate
7.16%
Mortgage Type
VA
Create a Home Valuation Report for This Property
The Home Valuation Report is an in-depth analysis detailing your home's value as well as a comparison with similar homes in the area
Home Values in the Area
Average Home Value in this Area
Purchase History
| Date | Buyer | Sale Price | Title Company |
|---|---|---|---|
| Wesson Donovan | $186,000 | Mccall Law Firm Pc | |
| Wang Xianyi | $85,000 | None Available | |
| Yang Xueling | $78,000 | Attorney | |
| Hawkins Sonja J | $87,000 | -- |
Source: Public Records
Mortgage History
| Date | Status | Borrower | Loan Amount |
|---|---|---|---|
| Open | Wesson Donovan | $173,821 | |
| Previous Owner | Hawkins Sonja J | $89,000 |
Source: Public Records
Tax History Compared to Growth
Tax History
| Year | Tax Paid | Tax Assessment Tax Assessment Total Assessment is a certain percentage of the fair market value that is determined by local assessors to be the total taxable value of land and additions on the property. | Land | Improvement |
|---|---|---|---|---|
| 2024 | $2,485 | $107,304 | $18,000 | $89,304 |
| 2023 | $1,902 | $107,304 | $18,000 | $89,304 |
| 2022 | $1,685 | $107,484 | $18,000 | $89,484 |
| 2021 | $1,685 | $107,484 | $18,000 | $89,484 |
| 2019 | $1,650 | $102,600 | $18,000 | $84,600 |
| 2018 | $1,650 | $102,600 | $18,000 | $84,600 |
| 2017 | $1,547 | $102,600 | $18,000 | $84,600 |
| 2016 | $1,538 | $113,000 | $16,000 | $97,000 |
| 2015 | $1,522 | $113,000 | $16,000 | $97,000 |
| 2014 | $1,515 | $113,000 | $16,000 | $97,000 |
Source: Public Records
Map
Nearby Homes
- 909 Montclair Rd
- 4313 Wellington Dr
- 741 Newport Rd
- 4300 Braemar Place
- 4476 Kinkead Ct
- 612 Brisbane Ct
- 4447 Wellington Dr
- 568 Broyhill Rd
- 4215 Ferncreek Dr
- 830 Astron Ln
- 830 Astron Ln Unit 102
- 1861 Jennifer Ln Unit 202
- 682 Montclair Rd
- 4204 Huntsfield Rd
- 1851 Jennifer Ln Unit 102
- 671 Newport Rd
- 4471 Briton Cir
- 845 Stoneykirk Dr
- 841 Stoneykirk Dr
- 849 Stoneykirk Dr
- 846 Stoneykirk Dr
- 853 Stoneykirk Dr
- 837 Stoneykirk Dr
- 842 Stoneykirk Dr
- 850 Stoneykirk Dr
- 854 Stoneykirk Dr
- 838 Stoneykirk Dr
- 833 Stoneykirk Dr
- 833 Stoneykirk Dr Unit 159
- 857 Stoneykirk Dr
- 834 Stoneykirk Dr
- 858 Stoneykirk Dr
- 861 Stoneykirk Dr
- 837 Montclair Rd
- 829 Stoneykirk Dr
- 841 Montclair Rd
- 833 Montclair Rd