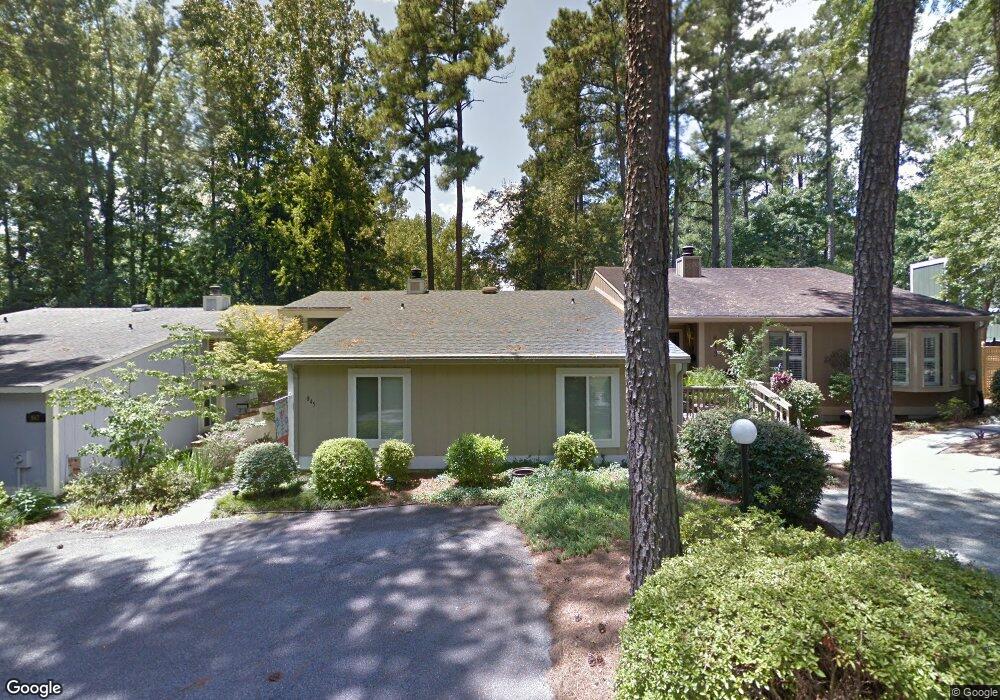
845 Wimbledon Dr Unit VIB Augusta, GA 30909
Lake Aumond NeighborhoodEstimated Value: $204,997 - $255,000
3
Beds
2
Baths
1,665
Sq Ft
$139/Sq Ft
Est. Value
About This Home
This home is located at 845 Wimbledon Dr Unit VIB, Augusta, GA 30909 and is currently estimated at $232,249, approximately $139 per square foot. 845 Wimbledon Dr Unit VIB is a home located in Richmond County with nearby schools including Lake Forest Hills Elementary School, Tutt Middle School, and Johnson Magnet.
Ownership History
Date
Name
Owned For
Owner Type
Purchase Details
Closed on
Jul 30, 2002
Sold by
Spanjer Carolyn D
Bought by
Grant Sheryl A
Current Estimated Value
Home Financials for this Owner
Home Financials are based on the most recent Mortgage that was taken out on this home.
Original Mortgage
$74,000
Outstanding Balance
$30,260
Interest Rate
6.62%
Estimated Equity
$201,989
Purchase Details
Closed on
Aug 24, 1998
Sold by
Sitton Gale D
Bought by
Spanjer Carolyn D
Home Financials for this Owner
Home Financials are based on the most recent Mortgage that was taken out on this home.
Original Mortgage
$78,850
Interest Rate
6.92%
Purchase Details
Closed on
Oct 21, 1996
Sold by
Bowden John J
Bought by
Sitton Gale D
Purchase Details
Closed on
Dec 10, 1993
Sold by
Harrison Otis W
Bought by
Bowden John J
Purchase Details
Closed on
Dec 9, 1993
Sold by
Zimmerman Debra L
Bought by
Harrison Otis W
Purchase Details
Closed on
Dec 1, 1981
Create a Home Valuation Report for This Property
The Home Valuation Report is an in-depth analysis detailing your home's value as well as a comparison with similar homes in the area
Home Values in the Area
Average Home Value in this Area
Purchase History
| Date | Buyer | Sale Price | Title Company |
|---|---|---|---|
| Grant Sheryl A | $84,000 | -- | |
| Spanjer Carolyn D | $83,000 | -- | |
| Sitton Gale D | $82,500 | -- | |
| Bowden John J | $79,500 | -- | |
| Harrison Otis W | -- | -- | |
| -- | $53,500 | -- |
Source: Public Records
Mortgage History
| Date | Status | Borrower | Loan Amount |
|---|---|---|---|
| Open | Grant Sheryl A | $74,000 | |
| Previous Owner | Spanjer Carolyn D | $78,850 |
Source: Public Records
Tax History
| Year | Tax Paid | Tax Assessment Tax Assessment Total Assessment is a certain percentage of the fair market value that is determined by local assessors to be the total taxable value of land and additions on the property. | Land | Improvement |
|---|---|---|---|---|
| 2025 | $589 | $71,904 | $10,000 | $61,904 |
| 2024 | $589 | $67,952 | $10,000 | $57,952 |
| 2023 | $1,682 | $76,032 | $10,000 | $66,032 |
| 2022 | $1,345 | $53,042 | $10,000 | $43,042 |
| 2021 | $1,253 | $45,764 | $10,000 | $35,764 |
| 2020 | $1,037 | $39,378 | $10,000 | $29,378 |
| 2019 | $1,112 | $39,378 | $10,000 | $29,378 |
| 2018 | $1,122 | $39,378 | $10,000 | $29,378 |
| 2017 | $1,115 | $39,378 | $10,000 | $29,378 |
| 2016 | $1,116 | $39,378 | $10,000 | $29,378 |
| 2015 | $1,125 | $39,378 | $10,000 | $29,378 |
| 2014 | $1,438 | $39,378 | $10,000 | $29,378 |
Source: Public Records
Map
Nearby Homes
- 855 Wimbledon Dr
- 3413 Kerry Place
- 3205 N Wimbledon Dr
- 4224 Match Point Dr
- 3506 Jamaica Dr
- 1408 Jackson Rd
- 3515 Jamaica Dr
- 3410 Walton Way
- 828 Dogwood Ln
- 3518 Nassau Dr
- 3427 Heather Dr
- 755 Tripps Ct
- 3221 Alpine Rd
- 3602 Nassau Dr
- 3341 Oakridge Dr
- 12 Summerville Ln
- 3509 Nassau Dr
- 3620 Jamaica Dr
- 3643 Bermuda Cir E
- 0 Wheeler Rd
- 847 Wimbledon Dr
- 843 Wimbledon Dr
- 841 Wimbledon Dr
- 849 Wimbledon Dr
- 647 Center Court Dr
- 840 Wimbledon Dr
- 645 Center Court Dr
- 649 Center Court Dr
- 838 Wimbledon Dr
- 842 Wimbledon Dr
- 839 Wimbledon Dr
- 643 Center Court Dr
- 851 Wimbledon Dr
- 651 Center Court Dr
- 836 Wimbledon Dr
- 844 Wimbledon Dr
- 837 Wimbledon Dr
- 834 Wimbledon Dr
- 3202 N Wimbledon Dr
- 3202 N Wimbledon Dr
Your Personal Tour Guide
Ask me questions while you tour the home.