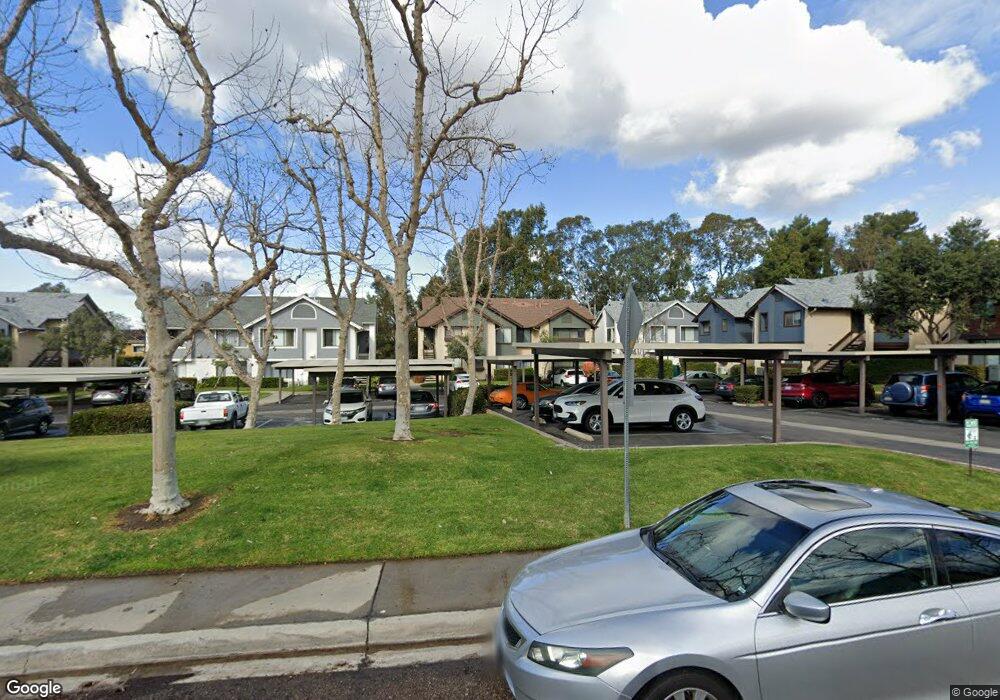
8450 Summerdale Rd Unit A San Diego, CA 92126
Mira Mesa NeighborhoodEstimated Value: $589,000 - $643,000
2
Beds
2
Baths
986
Sq Ft
$632/Sq Ft
Est. Value
About This Home
This home is located at 8450 Summerdale Rd Unit A, San Diego, CA 92126 and is currently estimated at $622,871, approximately $631 per square foot. 8450 Summerdale Rd Unit A is a home located in San Diego County with nearby schools including Ericson Elementary School, Wangenheim Middle School, and Mira Mesa High School.
Ownership History
Date
Name
Owned For
Owner Type
Purchase Details
Closed on
Mar 17, 2022
Sold by
Alan Levinson Lawrence and Lyn Illana
Bought by
Levinson Family Trust
Current Estimated Value
Purchase Details
Closed on
Nov 1, 2000
Sold by
King Aubrey B and King Barbara E
Bought by
Levinson Lawrence Alan and Levinson Illana Lyn
Home Financials for this Owner
Home Financials are based on the most recent Mortgage that was taken out on this home.
Original Mortgage
$150,000
Interest Rate
8.25%
Mortgage Type
Purchase Money Mortgage
Purchase Details
Closed on
Mar 25, 1988
Create a Home Valuation Report for This Property
The Home Valuation Report is an in-depth analysis detailing your home's value as well as a comparison with similar homes in the area
Home Values in the Area
Average Home Value in this Area
Purchase History
| Date | Buyer | Sale Price | Title Company |
|---|---|---|---|
| Levinson Family Trust | -- | Robinson & Wilson A Law Corpor | |
| Levinson Lawrence Alan | $150,000 | First American Title | |
| -- | $91,000 | -- |
Source: Public Records
Mortgage History
| Date | Status | Borrower | Loan Amount |
|---|---|---|---|
| Previous Owner | Levinson Lawrence Alan | $150,000 |
Source: Public Records
Tax History Compared to Growth
Tax History
| Year | Tax Paid | Tax Assessment Tax Assessment Total Assessment is a certain percentage of the fair market value that is determined by local assessors to be the total taxable value of land and additions on the property. | Land | Improvement |
|---|---|---|---|---|
| 2025 | $2,679 | $226,001 | $100,401 | $125,600 |
| 2024 | $2,679 | $221,571 | $98,433 | $123,138 |
| 2023 | $2,618 | $217,227 | $96,503 | $120,724 |
| 2022 | $2,632 | $212,968 | $94,611 | $118,357 |
| 2021 | $2,613 | $208,793 | $92,756 | $116,037 |
| 2020 | $2,582 | $206,653 | $91,805 | $114,848 |
| 2019 | $2,536 | $202,602 | $90,005 | $112,597 |
| 2018 | $2,373 | $198,631 | $88,241 | $110,390 |
| 2017 | $2,314 | $194,737 | $86,511 | $108,226 |
| 2016 | $2,277 | $190,919 | $84,815 | $106,104 |
| 2015 | $2,244 | $188,052 | $83,541 | $104,511 |
| 2014 | $2,209 | $184,369 | $81,905 | $102,464 |
Source: Public Records
Map
Nearby Homes
- 8446 Summerdale Rd Unit D
- 8388 Summerdale Rd Unit B
- 8353 Summerdale Rd Unit A
- 8503 Summerdale Rd Unit 376
- 8333 Calle Calzada
- 8509 Summerdale Rd Unit 365
- 8365 Westmore Rd Unit 20
- 10875 Camino Ruiz Unit 50
- 11034 Sagittarius Rd
- 8479 Westmore Rd Unit 55
- 8378 New Salem St Unit 24
- 8480 New Salem St Unit 103
- 8595 Summerdale Rd Unit 170
- 8468 Calle Morelos
- 11149 Blythe Rd
- 8644 New Salem St Unit 6
- 11313 Zapata Ave Unit 6
- 10794 Westonhill Dr
- 11187 Kelowna Rd Unit 76
- 11323 Trebol St
- 8380 Summerdale Rd
- 8454 Summerdale Rd Unit D
- 8418 Summerdale Rd
- 8454 Summerdale Rd Unit A
- 8458 Summerdale Rd
- 8450 Summerdale Rd Unit D
- 8450 Summerdale Rd Unit B
- 8446 Summerdale Rd Unit C
- 8446 Summerdale Rd Unit B
- 8434 Summerdale Rd Unit C
- 8434 Summerdale Rd Unit D
- 8434 Summerdale Rd Unit A
- 8434 Summerdale Rd Unit B
- 8426 Summerdale Rd Unit C
- 8426 Summerdale Rd Unit D
- 8426 Summerdale Rd Unit A
- 8426 Summerdale Rd Unit B
- 8418 Summerdale Rd Unit C
- 8418 Summerdale Rd Unit D
- 8418 Summerdale Rd Unit B