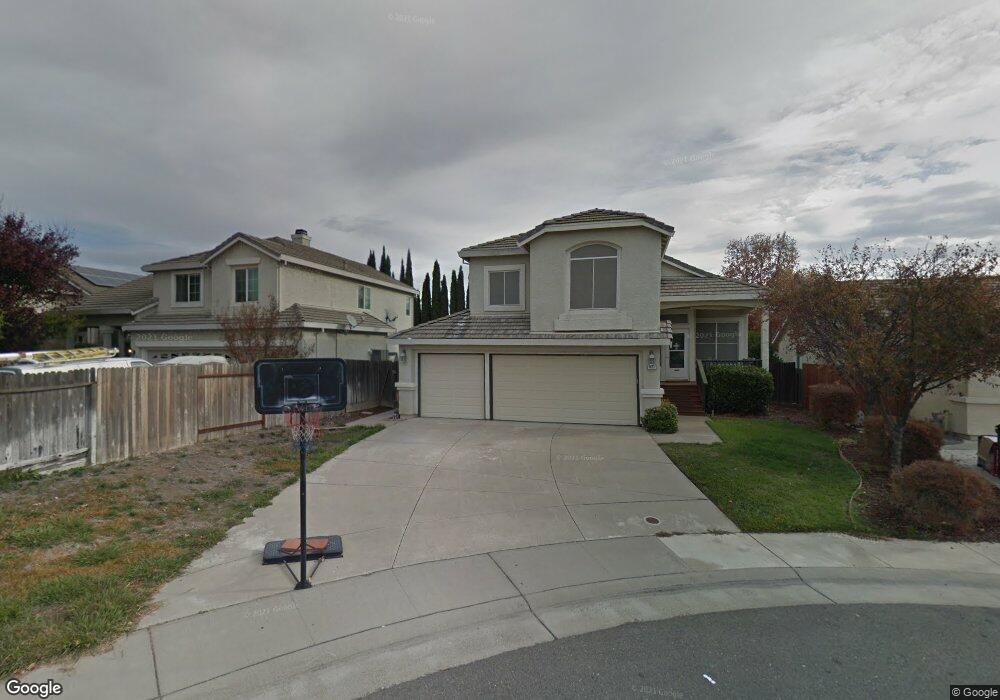
8451 Amaryllis Ct Elk Grove, CA 95624
North East Elk Grove NeighborhoodEstimated Value: $597,146 - $633,000
5
Beds
3
Baths
1,923
Sq Ft
$323/Sq Ft
Est. Value
About This Home
This home is located at 8451 Amaryllis Ct, Elk Grove, CA 95624 and is currently estimated at $620,537, approximately $322 per square foot. 8451 Amaryllis Ct is a home located in Sacramento County with nearby schools including Raymond Case Elementary School, Edward Harris Jr. Middle School, and Monterey Trail High School.
Ownership History
Date
Name
Owned For
Owner Type
Purchase Details
Closed on
Dec 21, 2006
Sold by
Stuchell Paul D
Bought by
Stuchell Julie E
Current Estimated Value
Home Financials for this Owner
Home Financials are based on the most recent Mortgage that was taken out on this home.
Original Mortgage
$315,000
Outstanding Balance
$187,391
Interest Rate
6.22%
Mortgage Type
New Conventional
Estimated Equity
$433,146
Purchase Details
Closed on
Dec 14, 1999
Sold by
Cordova Pedro J and Cordova Doris A
Bought by
Stuchell Paul D and Stuchell Julie E
Home Financials for this Owner
Home Financials are based on the most recent Mortgage that was taken out on this home.
Original Mortgage
$135,920
Interest Rate
7.75%
Purchase Details
Closed on
May 20, 1996
Sold by
M J Brock & Sons Inc
Bought by
Cordova Pedro J and Cordova Doris A
Create a Home Valuation Report for This Property
The Home Valuation Report is an in-depth analysis detailing your home's value as well as a comparison with similar homes in the area
Home Values in the Area
Average Home Value in this Area
Purchase History
| Date | Buyer | Sale Price | Title Company |
|---|---|---|---|
| Stuchell Julie E | -- | Liberty Title Company | |
| Stuchell Paul D | $170,000 | First American Title Ins Co | |
| Cordova Pedro J | $150,000 | Placer Title Company |
Source: Public Records
Mortgage History
| Date | Status | Borrower | Loan Amount |
|---|---|---|---|
| Open | Stuchell Julie E | $315,000 | |
| Closed | Stuchell Paul D | $135,920 |
Source: Public Records
Tax History Compared to Growth
Tax History
| Year | Tax Paid | Tax Assessment Tax Assessment Total Assessment is a certain percentage of the fair market value that is determined by local assessors to be the total taxable value of land and additions on the property. | Land | Improvement |
|---|---|---|---|---|
| 2025 | $3,336 | $298,740 | $61,465 | $237,275 |
| 2024 | $3,336 | $292,883 | $60,260 | $232,623 |
| 2023 | $3,250 | $287,141 | $59,079 | $228,062 |
| 2022 | $3,187 | $281,512 | $57,921 | $223,591 |
| 2021 | $3,140 | $275,993 | $56,786 | $219,207 |
| 2020 | $3,097 | $273,164 | $56,204 | $216,960 |
| 2019 | $3,038 | $267,808 | $55,102 | $212,706 |
| 2018 | $2,955 | $262,558 | $54,022 | $208,536 |
| 2017 | $2,902 | $257,411 | $52,963 | $204,448 |
| 2016 | $2,757 | $252,365 | $51,925 | $200,440 |
| 2015 | $2,705 | $248,576 | $51,146 | $197,430 |
| 2014 | $2,661 | $243,708 | $50,145 | $193,563 |
Source: Public Records
Map
Nearby Homes
- 8578 Hydrangea Ct
- 8541 Lupin Way
- 8643 Rothenburg Ct
- 8805 Coral Berry Way
- 8809 Coral Berry Way
- 8772 Crusheen Way
- 8447 Cassatt Way
- 8831 Liscarney Way
- 8788 Apricot Woods Way
- 8216 Exbourne Cir
- 8233 Short Rd
- 8659 Tegea Way
- 8836 Inisheer Way
- 8679 Bouvardia Ct
- 8609 Aviary Woods Way
- 8697 Tegea Way
- 8159 Morgan Hill Way
- 8170 Derbyshire Cir
- 8247 Derbyshire Cir
- 8770 Bottlebrush Ct
- 8445 Anthemis Ct
- 8455 Amaryllis Ct
- 8441 Anthemis Ct
- 8452 Water Poppy Way
- 8459 Amaryllis Ct
- 8448 Water Poppy Way
- 8456 Water Poppy Way
- 8444 Water Poppy Way
- 8460 Water Poppy Way
- 8450 Amaryllis Ct
- 8437 Anthemis Ct
- 8463 Amaryllis Ct
- 8444 Anthemis Ct
- 8454 Amaryllis Ct
- 8440 Water Poppy Way
- 8458 Amaryllis Ct
- 8440 Anthemis Ct
- 8464 Water Poppy Way
- 8467 Amaryllis Ct
- 8436 Anthemis Ct