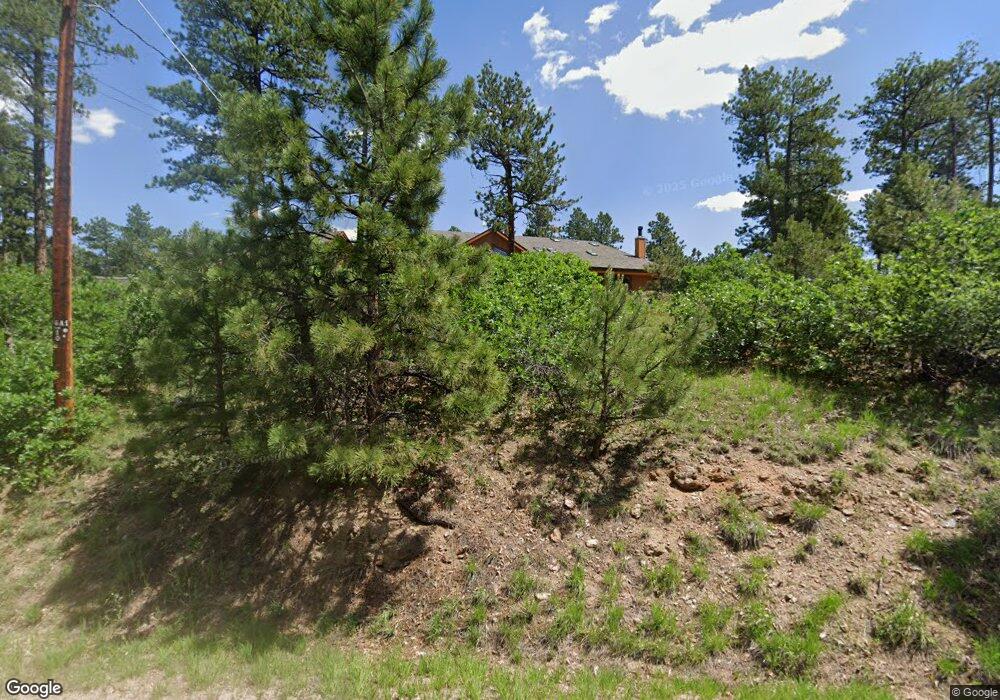
8453 S Ault Ln Morrison, CO 80465
Homestead NeighborhoodEstimated Value: $1,107,000 - $1,280,000
4
Beds
3
Baths
3,388
Sq Ft
$354/Sq Ft
Est. Value
About This Home
This home is located at 8453 S Ault Ln, Morrison, CO 80465 and is currently estimated at $1,198,306, approximately $353 per square foot. 8453 S Ault Ln is a home located in Jefferson County with nearby schools including West Jefferson Elementary School, West Jefferson Middle School, and Conifer Senior High School.
Ownership History
Date
Name
Owned For
Owner Type
Purchase Details
Closed on
Jul 2, 2019
Sold by
Chanecki Mark W and Chanecka Iga Z
Bought by
Carton Albert
Current Estimated Value
Home Financials for this Owner
Home Financials are based on the most recent Mortgage that was taken out on this home.
Original Mortgage
$725,000
Outstanding Balance
$637,496
Interest Rate
4%
Mortgage Type
New Conventional
Estimated Equity
$560,810
Purchase Details
Closed on
Oct 26, 2004
Sold by
Riegger Krugh Cheryl
Bought by
Chanecki Mark W and Chanecka Iga Z
Home Financials for this Owner
Home Financials are based on the most recent Mortgage that was taken out on this home.
Original Mortgage
$300,000
Interest Rate
3.72%
Mortgage Type
Negative Amortization
Purchase Details
Closed on
Dec 6, 1995
Sold by
Dotzenroth Gloria B
Bought by
Krugh Jerry F and Riegger Krugh Cheryl
Home Financials for this Owner
Home Financials are based on the most recent Mortgage that was taken out on this home.
Original Mortgage
$157,000
Interest Rate
7.41%
Create a Home Valuation Report for This Property
The Home Valuation Report is an in-depth analysis detailing your home's value as well as a comparison with similar homes in the area
Home Values in the Area
Average Home Value in this Area
Purchase History
| Date | Buyer | Sale Price | Title Company |
|---|---|---|---|
| Carton Albert | $815,000 | Chicago Title Co | |
| Chanecki Mark W | $375,000 | Fahtco | |
| Krugh Jerry F | $237,000 | Title America |
Source: Public Records
Mortgage History
| Date | Status | Borrower | Loan Amount |
|---|---|---|---|
| Open | Carton Albert | $725,000 | |
| Previous Owner | Chanecki Mark W | $300,000 | |
| Previous Owner | Krugh Jerry F | $157,000 |
Source: Public Records
Tax History
| Year | Tax Paid | Tax Assessment Tax Assessment Total Assessment is a certain percentage of the fair market value that is determined by local assessors to be the total taxable value of land and additions on the property. | Land | Improvement |
|---|---|---|---|---|
| 2024 | $6,918 | $78,094 | $23,535 | $54,559 |
| 2023 | $6,918 | $78,094 | $23,535 | $54,559 |
| 2022 | $5,595 | $62,257 | $14,601 | $47,656 |
| 2021 | $5,641 | $64,048 | $15,021 | $49,027 |
| 2020 | $4,379 | $49,856 | $8,540 | $41,316 |
| 2019 | $4,315 | $49,856 | $8,540 | $41,316 |
| 2018 | $4,276 | $47,759 | $11,563 | $36,196 |
| 2017 | $3,752 | $47,759 | $11,563 | $36,196 |
| 2016 | $4,306 | $51,171 | $10,440 | $40,731 |
| 2015 | $3,704 | $51,171 | $10,440 | $40,731 |
| 2014 | $3,704 | $41,239 | $9,097 | $32,142 |
Source: Public Records
Map
Nearby Homes
- 8220 Iowa Gulch Rd
- 8550 S Mariposa Dr
- 8066 Federation Dr
- Lot 1 Iowa Gulch Rd
- 8752 S Ault Ln
- 8171 S Homesteader Dr
- 8045 S Wagon Wheel Rd
- 8111 S Homesteader Dr
- 8722 S Ault Ln
- 8001 S Homesteader Dr
- 7871 Gold Rush Place Unit 3
- 7837 S Settlers Dr
- 7790 S Homesteader Dr
- 9146 Broken Bow Ranch Rd
- 22076 High Springs Trail
- 22056 High Spring Trail
- 7540 S Homesteader Dr
- 22725 Cook Ln
- 7552 Surrey Dr
- 21626 Lucky Star Dr
- 8393 S Ault Ln
- 8472 S Ault Ln
- 8422 S Ault Ln
- 8494 Us Highway 285
- 8553 S Ault Ln
- 8421 S Mariposa Dr
- 8341 S Mariposa Dr
- 8452 S Ault Ln
- 8380 S Mariposa Dr
- 8311 S Mariposa Dr
- 8311 S Mariposa Dr Unit A
- 8350 S Mariposa Dr
- 8552 S Ault Ln
- 8451 S Mariposa Dr
- 8330 S Mariposa Dr
- 8291 S Mariposa Dr
- 8573 S Ault Ln
- 8501 S Mariposa Dr
- 8572 S Ault Ln
- 20526 Flint Ln
Your Personal Tour Guide
Ask me questions while you tour the home.