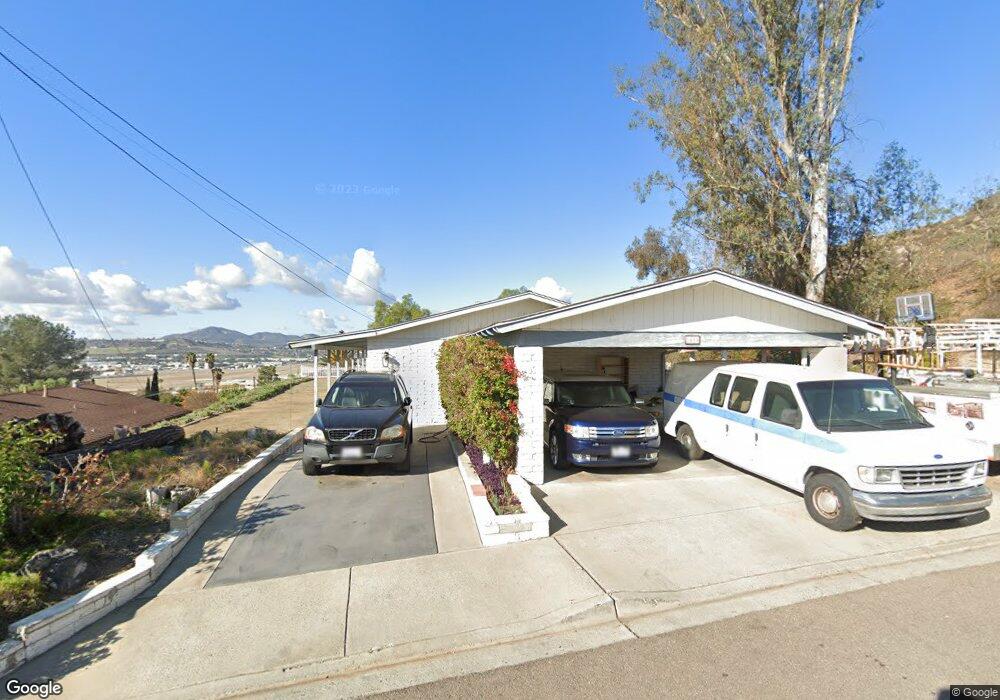
8454 Wenatchee Ave El Cajon, CA 92021
Bostonia NeighborhoodEstimated Value: $899,000 - $1,050,000
4
Beds
3
Baths
2,590
Sq Ft
$376/Sq Ft
Est. Value
About This Home
This home is located at 8454 Wenatchee Ave, El Cajon, CA 92021 and is currently estimated at $974,660, approximately $376 per square foot. 8454 Wenatchee Ave is a home located in San Diego County with nearby schools including Pepper Drive Elementary School, Santana High School, and Grossmont Secondary School.
Ownership History
Date
Name
Owned For
Owner Type
Purchase Details
Closed on
Aug 11, 2025
Sold by
John E Johnston Family Trust and Johnston Jondavid
Bought by
Johnston Jondavid and Johnston Perrette
Current Estimated Value
Home Financials for this Owner
Home Financials are based on the most recent Mortgage that was taken out on this home.
Original Mortgage
$696,500
Outstanding Balance
$695,891
Interest Rate
6.67%
Mortgage Type
New Conventional
Estimated Equity
$278,769
Purchase Details
Closed on
Jul 8, 2020
Sold by
Johnston John E
Bought by
Johnston John E and John E Johnston Family Trust
Purchase Details
Closed on
May 14, 2009
Sold by
Johnston John E
Bought by
Johnston John E and John E Johnston Family Trust
Purchase Details
Closed on
Feb 12, 2004
Sold by
Johnston John E
Bought by
Johnston John E
Purchase Details
Closed on
Jan 10, 2002
Sold by
Johnston John E
Bought by
Johnston John E
Create a Home Valuation Report for This Property
The Home Valuation Report is an in-depth analysis detailing your home's value as well as a comparison with similar homes in the area
Home Values in the Area
Average Home Value in this Area
Purchase History
| Date | Buyer | Sale Price | Title Company |
|---|---|---|---|
| Johnston Jondavid | $900,000 | Wfg National Title Company | |
| Johnston John E | -- | None Available | |
| Johnston John E | -- | Orange Coast Title Company | |
| Johnston John E | -- | -- | |
| Johnston John E | -- | -- |
Source: Public Records
Mortgage History
| Date | Status | Borrower | Loan Amount |
|---|---|---|---|
| Open | Johnston Jondavid | $696,500 |
Source: Public Records
Tax History Compared to Growth
Tax History
| Year | Tax Paid | Tax Assessment Tax Assessment Total Assessment is a certain percentage of the fair market value that is determined by local assessors to be the total taxable value of land and additions on the property. | Land | Improvement |
|---|---|---|---|---|
| 2025 | $1,721 | $139,245 | $27,916 | $111,329 |
| 2024 | $1,721 | $136,516 | $27,369 | $109,147 |
| 2023 | $1,666 | $133,840 | $26,833 | $107,007 |
| 2022 | $1,651 | $131,216 | $26,307 | $104,909 |
| 2021 | $1,632 | $128,644 | $25,792 | $102,852 |
| 2020 | $1,532 | $127,326 | $25,528 | $101,798 |
| 2019 | $1,481 | $124,830 | $25,028 | $99,802 |
| 2018 | $1,449 | $122,384 | $24,538 | $97,846 |
| 2017 | $860 | $119,985 | $24,057 | $95,928 |
| 2016 | $1,383 | $117,634 | $23,586 | $94,048 |
| 2015 | $1,356 | $115,868 | $23,232 | $92,636 |
| 2014 | $1,328 | $113,599 | $22,777 | $90,822 |
Source: Public Records
Map
Nearby Homes
- 5120 Sevilla St
- 8445 Graves Ave Unit 1
- 6301 Triana St
- 1772 Summertime Dr
- 1652 Summertime Dr
- 8731 Graves Ave Unit 42
- 1110 Calabria St Unit 10
- 1701 Summertime Dr
- 318 Graves Ct
- 309 Sun Ct
- 411 Danny St
- 1605 Calabria St
- 321 Sun Ct
- 1507 Calabria St
- 1673 Stone Edge Cir
- 450 E Bradley Ave Unit 115
- 450 E Bradley Ave Unit 127
- 450 E Bradley Ave Unit 36
- 450 E Bradley Ave Unit 144
- 450 E Bradley Ave Unit 157
- 1390 Wenatchee Ave
- 1386 Wenatchee Ave Unit 88
- 8428 Poinciana Dr
- 8459 Wenatchee Ave
- 8428-8430 Poinciana Dr
- 8447 Wenatchee Ave
- 1380 Wenatchee Ave
- 8443 Wenatchee Ave
- 8435 Wenatchee Ave
- 8424 Poinciana Dr
- 1443 Roxanne Dr
- 1435 Roxanne Dr Unit Room 2
- 1435 Roxanne Dr Unit Room 1
- 1435 Roxanne Dr
- 2036 Marlinda Way
- 2040 Marlinda Way Unit 2
- 2040 Marlinda Way
- 2040 Marlinda Way
- 1427 Roxanne Dr
- 8400 Poinciana Dr