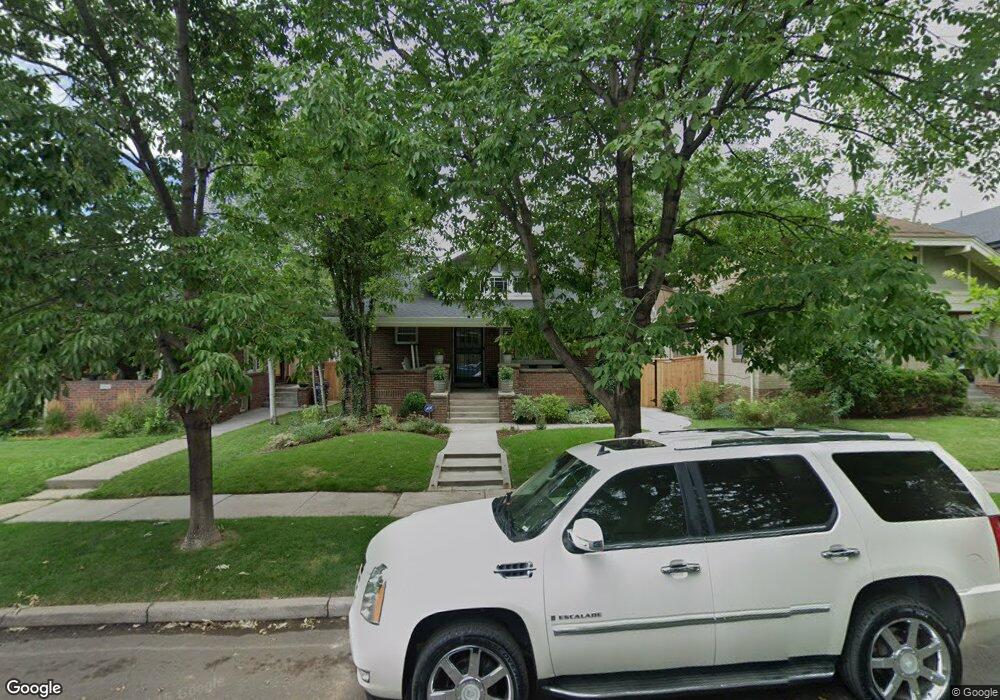
846 Adams St Denver, CO 80206
Congress Park NeighborhoodEstimated Value: $976,000 - $1,140,000
2
Beds
3
Baths
1,517
Sq Ft
$690/Sq Ft
Est. Value
About This Home
This home is located at 846 Adams St, Denver, CO 80206 and is currently estimated at $1,047,077, approximately $690 per square foot. 846 Adams St is a home located in Denver County with nearby schools including Teller Elementary School, Morey Middle School, and East High School.
Ownership History
Date
Name
Owned For
Owner Type
Purchase Details
Closed on
Aug 24, 2004
Sold by
Perkins Catherine
Bought by
Johnson Desmond Q and Johnson Catherine Eleanor
Current Estimated Value
Home Financials for this Owner
Home Financials are based on the most recent Mortgage that was taken out on this home.
Original Mortgage
$218,000
Outstanding Balance
$106,363
Interest Rate
6.08%
Mortgage Type
Purchase Money Mortgage
Estimated Equity
$940,714
Purchase Details
Closed on
Jan 27, 1999
Sold by
Sullivan John D
Bought by
Perkins Catherine
Home Financials for this Owner
Home Financials are based on the most recent Mortgage that was taken out on this home.
Original Mortgage
$228,800
Interest Rate
5.87%
Purchase Details
Closed on
Sep 14, 1998
Sold by
Thornton Jennie L
Bought by
Sullivan John D
Home Financials for this Owner
Home Financials are based on the most recent Mortgage that was taken out on this home.
Original Mortgage
$166,800
Interest Rate
7.62%
Create a Home Valuation Report for This Property
The Home Valuation Report is an in-depth analysis detailing your home's value as well as a comparison with similar homes in the area
Home Values in the Area
Average Home Value in this Area
Purchase History
| Date | Buyer | Sale Price | Title Company |
|---|---|---|---|
| Johnson Desmond Q | -- | -- | |
| Perkins Catherine | $286,000 | -- | |
| Sullivan John D | $208,559 | -- |
Source: Public Records
Mortgage History
| Date | Status | Borrower | Loan Amount |
|---|---|---|---|
| Open | Johnson Desmond Q | $218,000 | |
| Previous Owner | Perkins Catherine | $228,800 | |
| Previous Owner | Sullivan John D | $166,800 |
Source: Public Records
Tax History
| Year | Tax Paid | Tax Assessment Tax Assessment Total Assessment is a certain percentage of the fair market value that is determined by local assessors to be the total taxable value of land and additions on the property. | Land | Improvement |
|---|---|---|---|---|
| 2025 | $5,386 | $72,210 | $41,110 | $41,110 |
| 2024 | $5,386 | $68,000 | $40,070 | $27,930 |
| 2023 | $5,269 | $68,000 | $40,070 | $27,930 |
| 2022 | $3,952 | $49,690 | $25,940 | $23,750 |
| 2021 | $3,814 | $51,110 | $26,680 | $24,430 |
| 2020 | $3,514 | $47,360 | $15,010 | $32,350 |
| 2019 | $3,415 | $47,360 | $15,010 | $32,350 |
| 2018 | $2,837 | $36,670 | $13,440 | $23,230 |
| 2017 | $2,829 | $36,670 | $13,440 | $23,230 |
| 2016 | $3,058 | $37,500 | $12,999 | $24,501 |
| 2015 | $2,930 | $37,500 | $12,999 | $24,501 |
| 2014 | $2,824 | $34,000 | $19,406 | $14,594 |
Source: Public Records
Map
Nearby Homes
- 909 Madison St
- 800 Steele St
- 1013 Adams St
- 756 Steele St
- 1060 Cook St
- 864 Garfield St
- 1070 Cook St Unit 1072
- 680 Madison St
- 1123 Monroe St Unit 1125
- 801 Harrison St
- 848 Harrison St
- 3720 E 7th Avenue Pkwy
- 566 Cook St Unit 570
- 576 Steele St
- 1201 Steele St
- 570 Steele St
- 1217 Monroe St
- 594 Saint Paul St
- 1109 Harrison St
- 1035 Colorado Blvd Unit 406
Your Personal Tour Guide
Ask me questions while you tour the home.