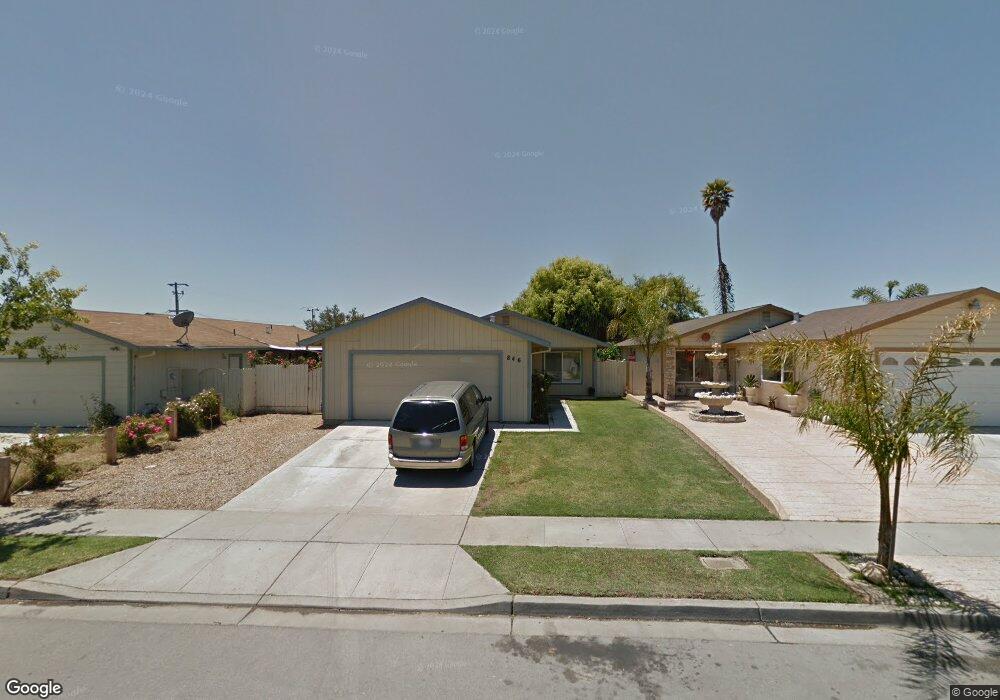
846 Bermuda Way Salinas, CA 93905
East Salinas NeighborhoodEstimated Value: $558,000 - $683,000
3
Beds
2
Baths
1,287
Sq Ft
$472/Sq Ft
Est. Value
About This Home
This home is located at 846 Bermuda Way, Salinas, CA 93905 and is currently estimated at $607,078, approximately $471 per square foot. 846 Bermuda Way is a home located in Monterey County with nearby schools including Frank Paul Elementary School, La Paz Middle School, and Alisal High School.
Ownership History
Date
Name
Owned For
Owner Type
Purchase Details
Closed on
Oct 7, 2003
Sold by
Robledo Juan and Robledo Maclovia
Bought by
Robledo Juan and Robledo Maclovia
Current Estimated Value
Home Financials for this Owner
Home Financials are based on the most recent Mortgage that was taken out on this home.
Original Mortgage
$217,000
Outstanding Balance
$102,583
Interest Rate
6.4%
Mortgage Type
Purchase Money Mortgage
Estimated Equity
$504,495
Purchase Details
Closed on
Jul 26, 2002
Sold by
Rizo Jorge
Bought by
Robledo Martha
Home Financials for this Owner
Home Financials are based on the most recent Mortgage that was taken out on this home.
Original Mortgage
$38,423
Interest Rate
6.6%
Mortgage Type
Credit Line Revolving
Purchase Details
Closed on
Sep 16, 1999
Sold by
Rider Property Development
Bought by
Robledo Juan and Robledo Maclovia
Home Financials for this Owner
Home Financials are based on the most recent Mortgage that was taken out on this home.
Original Mortgage
$145,500
Interest Rate
8.09%
Create a Home Valuation Report for This Property
The Home Valuation Report is an in-depth analysis detailing your home's value as well as a comparison with similar homes in the area
Home Values in the Area
Average Home Value in this Area
Purchase History
| Date | Buyer | Sale Price | Title Company |
|---|---|---|---|
| Robledo Juan | -- | Chicago Title | |
| Robledo Martha | -- | Stewart Title | |
| Robledo Juan | -- | Stewart Title | |
| Robledo Marilu | -- | Stewart Title | |
| Robledo Juan | $150,000 | Stewart Title |
Source: Public Records
Mortgage History
| Date | Status | Borrower | Loan Amount |
|---|---|---|---|
| Open | Robledo Juan | $217,000 | |
| Closed | Robledo Marilu | $38,423 | |
| Previous Owner | Robledo Juan | $145,500 |
Source: Public Records
Tax History Compared to Growth
Tax History
| Year | Tax Paid | Tax Assessment Tax Assessment Total Assessment is a certain percentage of the fair market value that is determined by local assessors to be the total taxable value of land and additions on the property. | Land | Improvement |
|---|---|---|---|---|
| 2025 | $3,038 | $230,528 | $99,893 | $130,635 |
| 2024 | $3,038 | $226,009 | $97,935 | $128,074 |
| 2023 | $2,983 | $221,578 | $96,015 | $125,563 |
| 2022 | $2,684 | $217,234 | $94,133 | $123,101 |
| 2021 | $2,685 | $212,976 | $92,288 | $120,688 |
| 2020 | $2,655 | $210,793 | $91,342 | $119,451 |
| 2019 | $2,739 | $206,660 | $89,551 | $117,109 |
| 2018 | $2,581 | $202,609 | $87,796 | $114,813 |
| 2017 | $2,679 | $198,637 | $86,075 | $112,562 |
| 2016 | $2,541 | $194,743 | $84,388 | $110,355 |
| 2015 | $2,519 | $191,819 | $83,121 | $108,698 |
| 2014 | $2,428 | $188,062 | $81,493 | $106,569 |
Source: Public Records
Map
Nearby Homes
- 811 Kilbreth Ave
- 852 Antigua Ave
- 742 Pino Way
- 1454 Madrone Dr
- 948 Rider Ave
- 704 Garner Ave Unit 3
- 1049 Twin Creeks Dr
- 7 Massachusetts Cir
- 709 Gee St
- 831 Cactus Ct
- 8 Bristol Cir
- 1392 New Hampshire Ct
- 914 Acosta Plaza Unit 91
- 914 Acosta Plaza Unit 111
- 914 Acosta Plaza Unit 94
- 917 Acosta Plaza Unit 4
- 919 Acosta Plaza Unit 41
- 1413 Wiren St
- 1920 Constitution Blvd Unit 36
- 918 Acosta Plaza Unit 61
- 842 Bermuda Way
- 850 Bermuda Way
- 1245 Pacific Ave
- 838 Bermuda Way
- 1242 Tahiti Place
- 1241 Pacific Ave
- 834 Bermuda Way
- 1245 Tahiti Place
- 847 Bermuda Way
- 843 Bermuda Way
- 851 Bermuda Way
- 839 Bermuda Way
- 1250 Pacific Ave
- 1254 Pacific Ave
- 830 Bermuda Way
- 1237 Pacific Ave
- 1258 Pacific Ave
- 1246 Pacific Ave
- 1238 Tahiti Place
- 835 Bermuda Way