846 Pearson Cir Unit 4 Youngstown, OH 44512
Estimated Value: $113,000 - $129,000
2
Beds
2
Baths
1,165
Sq Ft
$104/Sq Ft
Est. Value
About This Home
This home is located at 846 Pearson Cir Unit 4, Youngstown, OH 44512 and is currently estimated at $121,146, approximately $103 per square foot. 846 Pearson Cir Unit 4 is a home located in Mahoning County with nearby schools including Robinwood Lane Elementary School, Boardman Glenwood Junior High School, and Boardman High School.
Ownership History
Date
Name
Owned For
Owner Type
Purchase Details
Closed on
Mar 24, 2023
Bought by
Anthony W Mastrangelo
Current Estimated Value
Purchase Details
Closed on
Jul 25, 2007
Sold by
Yurko Kimberly and Yurko John A
Bought by
Mastrangelo Anthony W
Home Financials for this Owner
Home Financials are based on the most recent Mortgage that was taken out on this home.
Original Mortgage
$52,000
Interest Rate
6.69%
Mortgage Type
Purchase Money Mortgage
Purchase Details
Closed on
Feb 7, 2002
Sold by
Clarke Mary J
Bought by
Daley Kimberly
Home Financials for this Owner
Home Financials are based on the most recent Mortgage that was taken out on this home.
Original Mortgage
$55,550
Interest Rate
7.14%
Mortgage Type
Purchase Money Mortgage
Purchase Details
Closed on
Apr 15, 1985
Bought by
Clarke Mary J
Create a Home Valuation Report for This Property
The Home Valuation Report is an in-depth analysis detailing your home's value as well as a comparison with similar homes in the area
Home Values in the Area
Average Home Value in this Area
Purchase History
| Date | Buyer | Sale Price | Title Company |
|---|---|---|---|
| Anthony W Mastrangelo | -- | -- | |
| Mastrangelo Anthony W | $65,000 | Attorney | |
| Daley Kimberly | $58,500 | -- | |
| Clarke Mary J | -- | -- |
Source: Public Records
Mortgage History
| Date | Status | Borrower | Loan Amount |
|---|---|---|---|
| Previous Owner | Mastrangelo Anthony W | $52,000 | |
| Previous Owner | Daley Kimberly | $55,550 |
Source: Public Records
Tax History Compared to Growth
Tax History
| Year | Tax Paid | Tax Assessment Tax Assessment Total Assessment is a certain percentage of the fair market value that is determined by local assessors to be the total taxable value of land and additions on the property. | Land | Improvement |
|---|---|---|---|---|
| 2024 | $1,658 | $31,660 | $2,450 | $29,210 |
| 2023 | $1,636 | $31,660 | $2,450 | $29,210 |
| 2022 | $1,210 | $17,770 | $2,000 | $15,770 |
| 2021 | $1,211 | $17,770 | $2,000 | $15,770 |
| 2020 | $1,217 | $17,770 | $2,000 | $15,770 |
| 2019 | $1,217 | $15,580 | $1,750 | $13,830 |
| 2018 | $1,043 | $15,580 | $1,750 | $13,830 |
| 2017 | $1,105 | $15,580 | $1,750 | $13,830 |
| 2016 | $1,182 | $17,790 | $2,630 | $15,160 |
| 2015 | $1,160 | $17,790 | $2,630 | $15,160 |
| 2014 | $1,163 | $17,790 | $2,630 | $15,160 |
| 2013 | $1,149 | $17,790 | $2,630 | $15,160 |
Source: Public Records
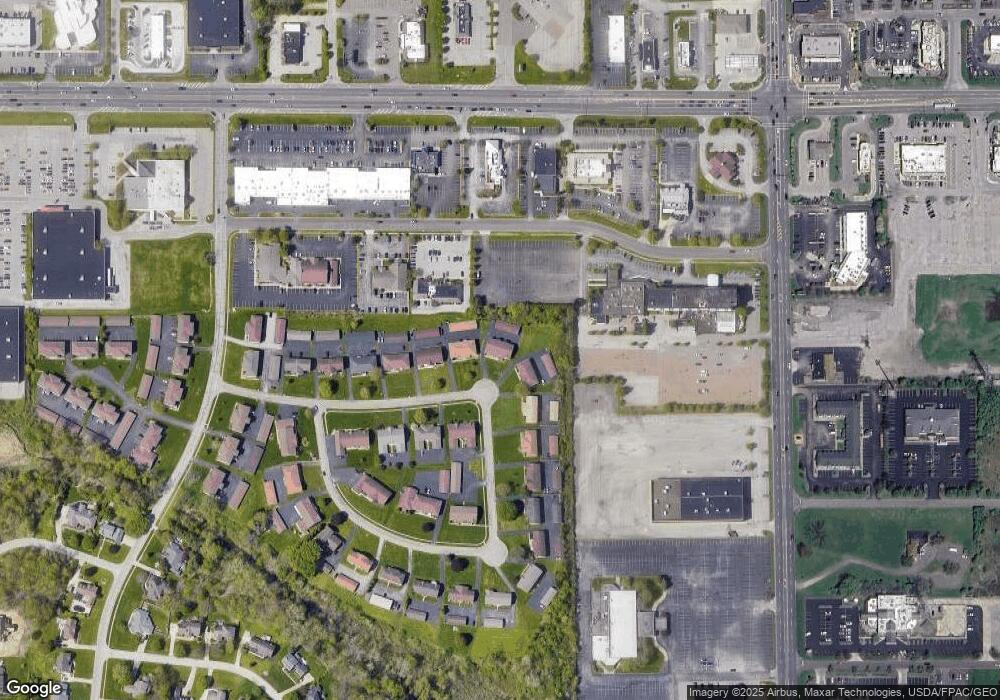
Map
Nearby Homes
- 829 Pearson Cir
- 816 Pearson Un#1
- 912 Pearson Cir Unit 5
- 918 Pearson Cir Unit 4
- 930 Pearson Cir Unit 4
- 942 Pearson Cir Unit 4
- 7368 Eisenhower Dr Unit 5
- 8360 South Ave
- 7708 Buchanan Dr
- 0 Saddlebrook Lot 156 Dr Unit 4442599
- 0 Saddlebrook Lot 153 Dr Unit 4442592
- 0 Saddlebrook Lot 123 Dr Unit 4442579
- 785 Terraview Dr
- 7680 Paulin Dr
- 681 Saddlebrook Dr
- 873 Auburn Hills Dr Unit 3
- 772 Teakwood Dr
- 6278 Appleridge Dr
- 7733 Crimson Trail Unit B
- 857 Maple Ridge Dr
- 846 Pearson Cir Unit 3
- 846 Pearson Cir Unit 2
- 846 Pearson Cir Unit 1
- 840 Pearson Cir Unit 4
- 840 Pearson Cir Unit 3
- 840 Pearson Cir Unit 2
- 840 Pearson Cir Unit 1
- 840 Pearson Cir
- 852 Pearson Cir Unit 4
- 852 Pearson Cir Unit 3
- 852 Pearson Cir Unit 2
- 852 Pearson Cir Unit 1
- 834 Pearson Cir Unit 4
- 834 Pearson Cir Unit 3
- 834 Pearson Cir Unit 2
- 834 Pearson Cir Unit 1
- 858 Pearson Cir Unit 4
- 858 Pearson Cir Unit 3
- 858 Pearson Cir Unit 2
- 858 Pearson Cir Unit 1