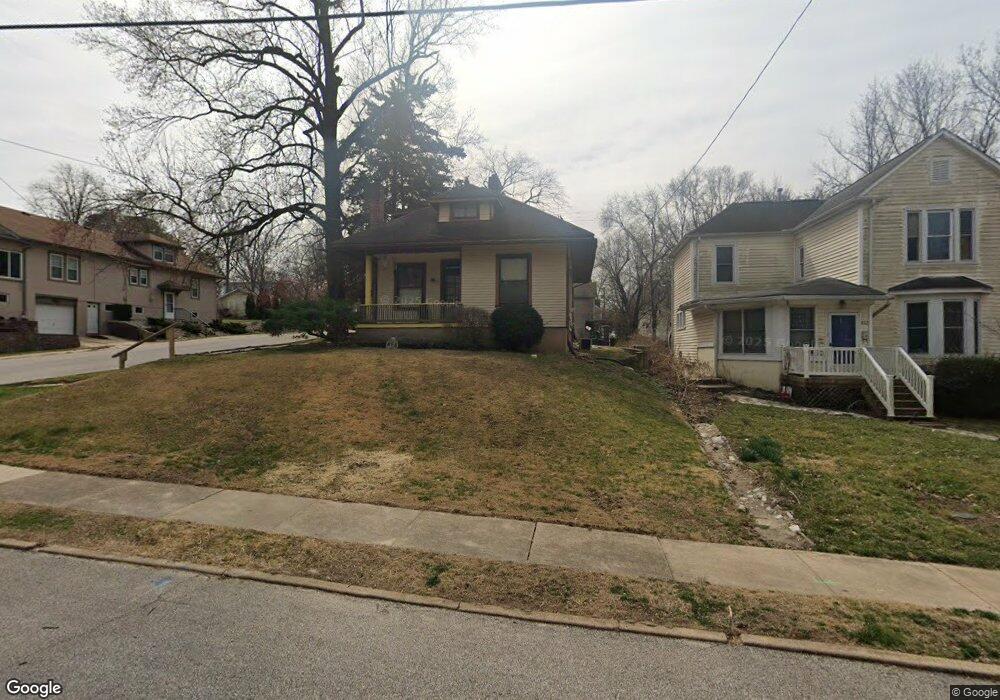
846 Tuxedo Blvd Saint Louis, MO 63119
Estimated Value: $270,000 - $331,000
2
Beds
1
Bath
1,041
Sq Ft
$284/Sq Ft
Est. Value
About This Home
This home is located at 846 Tuxedo Blvd, Saint Louis, MO 63119 and is currently estimated at $295,223, approximately $283 per square foot. 846 Tuxedo Blvd is a home located in St. Louis County with nearby schools including Avery Elementary School, Hixson Middle School, and Webster Groves High School.
Ownership History
Date
Name
Owned For
Owner Type
Purchase Details
Closed on
Sep 23, 2013
Sold by
Sweets Anne M
Bought by
Sweets Anne M and The Clarence A Sweets Residuary Trust
Current Estimated Value
Purchase Details
Closed on
Apr 22, 2007
Sold by
Sweets Stephen M and Sweets Clarence A
Bought by
Sweets Clarence A and Sweets Anne M
Purchase Details
Closed on
May 25, 2001
Sold by
Sweets Stephen M
Bought by
Sweets Stephen M and Sweets Clarence A
Home Financials for this Owner
Home Financials are based on the most recent Mortgage that was taken out on this home.
Original Mortgage
$88,014
Outstanding Balance
$32,962
Interest Rate
7.07%
Mortgage Type
FHA
Estimated Equity
$262,261
Purchase Details
Closed on
Dec 27, 2000
Sold by
Haller Diann M and Haller Thomas
Bought by
Sweets Stephen M
Create a Home Valuation Report for This Property
The Home Valuation Report is an in-depth analysis detailing your home's value as well as a comparison with similar homes in the area
Home Values in the Area
Average Home Value in this Area
Purchase History
| Date | Buyer | Sale Price | Title Company |
|---|---|---|---|
| Sweets Anne M | -- | None Available | |
| Sweets Clarence A | -- | None Available | |
| Sweets Stephen M | -- | Capital Title | |
| Sweets Stephen M | $103,500 | -- | |
| Sweets Stephen M | -- | -- |
Source: Public Records
Mortgage History
| Date | Status | Borrower | Loan Amount |
|---|---|---|---|
| Open | Sweets Stephen M | $88,014 |
Source: Public Records
Tax History Compared to Growth
Tax History
| Year | Tax Paid | Tax Assessment Tax Assessment Total Assessment is a certain percentage of the fair market value that is determined by local assessors to be the total taxable value of land and additions on the property. | Land | Improvement |
|---|---|---|---|---|
| 2025 | $3,311 | $53,890 | $42,470 | $11,420 |
| 2024 | $3,311 | $47,310 | $30,890 | $16,420 |
| 2023 | $3,295 | $47,310 | $30,890 | $16,420 |
| 2022 | $3,367 | $44,910 | $30,890 | $14,020 |
| 2021 | $3,355 | $44,910 | $30,890 | $14,020 |
| 2020 | $3,191 | $39,760 | $30,890 | $8,870 |
| 2019 | $3,168 | $39,760 | $30,890 | $8,870 |
| 2018 | $2,889 | $32,150 | $21,620 | $10,530 |
| 2017 | $2,870 | $32,150 | $21,620 | $10,530 |
| 2016 | $3,275 | $35,230 | $18,530 | $16,700 |
| 2015 | $3,285 | $35,230 | $18,530 | $16,700 |
| 2014 | $2,529 | $26,320 | $13,550 | $12,770 |
Source: Public Records
Map
Nearby Homes
- 874 Tuxedo Blvd
- 808 Greeley Ave
- 544 Summit Ave
- 946 Newport Ave
- 570 N Laclede Station Rd
- 554 N Laclede Station Rd
- 706 Atalanta Ave
- 685 Clark Ave
- 1016 Marshall Ave
- 1048 Kuhlman Ln
- 1045 Tuxedo Blvd
- 619 N Bompart Ave
- 1052 Kuhlman Ln
- 835 N Forest Ave
- 817 N Forest Ave
- 7723 Suffolk Ave
- 1051 Kuhlman Ln
- 1046 Marshall Ave
- 804 E Pacific Ave
- 1088 Key Ave W
- 842 Tuxedo Blvd
- 852 Tuxedo Blvd
- 832 Tuxedo Blvd
- 856 Tuxedo Blvd
- 853 Greeley Ave
- 857 Greeley Ave
- 837 Greeley Ave
- 828 Tuxedo Blvd
- 847 Tuxedo Blvd
- 859 Greeley Ave
- 849 Tuxedo Blvd
- 833 Greeley Ave
- 866 Tuxedo Blvd
- 0 Unknown Unit 18039533
- 831 Greeley Tbb
- 0 Unknown Unit 19021430
- 824 Tuxedo Blvd
- 835 Tuxedo Blvd
- 831 Greeley Ave
- 831TBB Greeley Ave