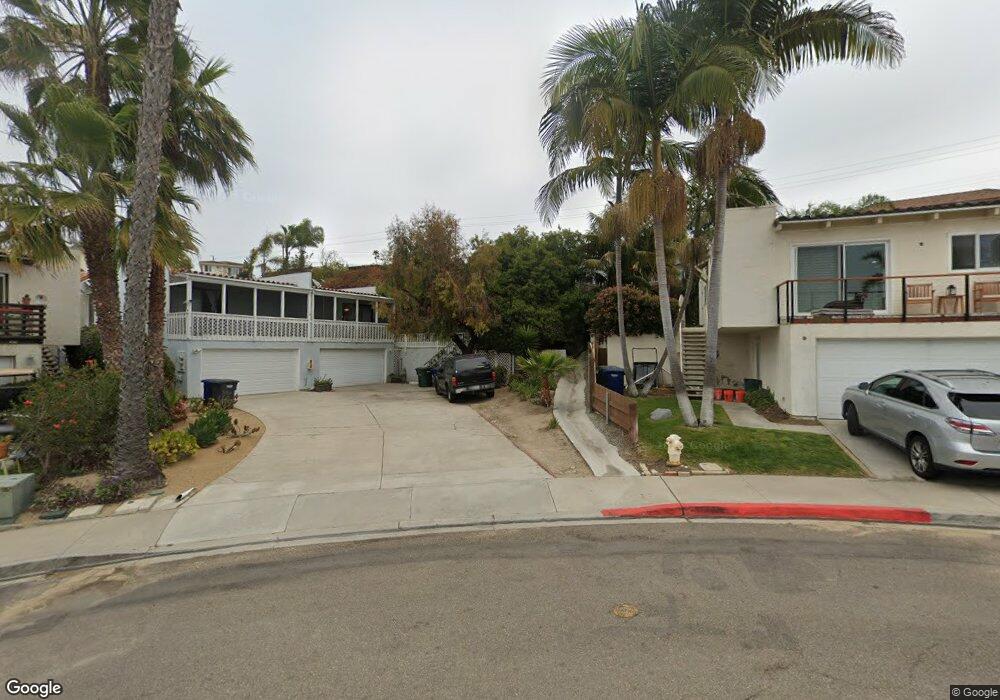
846 Viva Ct Solana Beach, CA 92075
Estimated Value: $2,197,000 - $2,433,781
3
Beds
2
Baths
1,240
Sq Ft
$1,899/Sq Ft
Est. Value
About This Home
This home is located at 846 Viva Ct, Solana Beach, CA 92075 and is currently estimated at $2,354,695, approximately $1,898 per square foot. 846 Viva Ct is a home located in San Diego County with nearby schools including Skyline Elementary School, Solana Vista Elementary School, and Earl Warren Middle School.
Ownership History
Date
Name
Owned For
Owner Type
Purchase Details
Closed on
Nov 14, 2017
Sold by
Cooper Bryan D and Trust Of Doreen E Christian
Bought by
Stang Peter M and The Stang Family Trust
Current Estimated Value
Purchase Details
Closed on
Jun 30, 2005
Sold by
Christian Doreen E
Bought by
Christian Doreen E
Home Financials for this Owner
Home Financials are based on the most recent Mortgage that was taken out on this home.
Original Mortgage
$337,000
Interest Rate
5.65%
Mortgage Type
New Conventional
Purchase Details
Closed on
Jun 27, 2005
Sold by
Christian Doreen E
Bought by
Christian Doreen E and Trust Of Doreen E Christian
Home Financials for this Owner
Home Financials are based on the most recent Mortgage that was taken out on this home.
Original Mortgage
$337,000
Interest Rate
5.65%
Mortgage Type
New Conventional
Purchase Details
Closed on
Jun 20, 2003
Sold by
Christian Doreen E and Christian Doreen
Bought by
Christian Doreen E
Purchase Details
Closed on
Sep 5, 1991
Purchase Details
Closed on
Sep 16, 1986
Create a Home Valuation Report for This Property
The Home Valuation Report is an in-depth analysis detailing your home's value as well as a comparison with similar homes in the area
Home Values in the Area
Average Home Value in this Area
Purchase History
| Date | Buyer | Sale Price | Title Company |
|---|---|---|---|
| Stang Peter M | $1,289,000 | Fidelity National Title San | |
| Christian Doreen E | -- | -- | |
| Christian Doreen E | -- | Gateway Title Company | |
| Christian Doreen E | -- | -- | |
| -- | $300,000 | -- | |
| -- | $225,000 | -- |
Source: Public Records
Mortgage History
| Date | Status | Borrower | Loan Amount |
|---|---|---|---|
| Previous Owner | Christian Doreen E | $337,000 |
Source: Public Records
Tax History Compared to Growth
Tax History
| Year | Tax Paid | Tax Assessment Tax Assessment Total Assessment is a certain percentage of the fair market value that is determined by local assessors to be the total taxable value of land and additions on the property. | Land | Improvement |
|---|---|---|---|---|
| 2025 | $16,761 | $1,466,657 | $1,171,962 | $294,695 |
| 2024 | $16,761 | $1,437,900 | $1,148,983 | $288,917 |
| 2023 | $16,425 | $1,409,706 | $1,126,454 | $283,252 |
| 2022 | $16,184 | $1,382,066 | $1,104,367 | $277,699 |
| 2021 | $15,922 | $1,354,967 | $1,082,713 | $272,254 |
| 2020 | $15,794 | $1,341,075 | $1,071,612 | $269,463 |
| 2019 | $15,515 | $1,314,780 | $1,050,600 | $264,180 |
| 2018 | $6,433 | $466,898 | $311,270 | $155,628 |
| 2017 | $6,316 | $457,744 | $305,167 | $152,577 |
| 2016 | $5,985 | $448,770 | $299,184 | $149,586 |
| 2015 | $5,886 | $442,030 | $294,690 | $147,340 |
| 2014 | $5,764 | $433,372 | $288,918 | $144,454 |
Source: Public Records
Map
Nearby Homes
- 818 Viva Ct
- 825 Gonzales St
- 811 Highland Dr
- 526 Via de la Valle Unit A
- 528 Via de la Valle Unit H
- 524 Via de la Valle Unit H
- 1046 America Way Unit 28
- 1035 Reliance Way
- 701 Valley Ave
- 1047 Highland Dr
- Plan 4 at Drift
- Plan 3 at Drift
- Plan 5 at Drift
- Plan 2 at Drift
- Plan 1 at Drift
- 773 E Solana Cir
- 15793 Caminito Cantaras
- 1240 Ladera Linda
- 219 Turf View Dr Unit 30
- 876 Cofair Ct