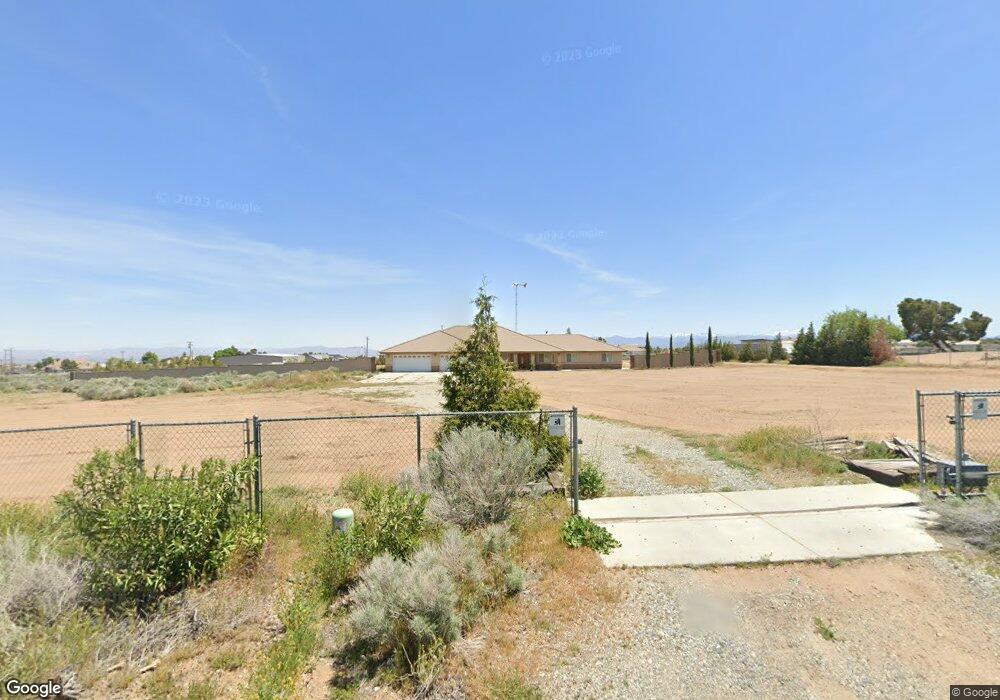
8465 Cedar Ct Phelan, CA 92371
Estimated Value: $662,000 - $930,000
4
Beds
3
Baths
3,027
Sq Ft
$246/Sq Ft
Est. Value
About This Home
This home is located at 8465 Cedar Ct, Phelan, CA 92371 and is currently estimated at $745,888, approximately $246 per square foot. 8465 Cedar Ct is a home located in San Bernardino County with nearby schools including Baldy Mesa Elementary School, Quail Valley Middle School, and Serrano High School.
Ownership History
Date
Name
Owned For
Owner Type
Purchase Details
Closed on
Mar 17, 2009
Sold by
Potter Tim
Bought by
Reiss Andrew W
Current Estimated Value
Home Financials for this Owner
Home Financials are based on the most recent Mortgage that was taken out on this home.
Original Mortgage
$199,900
Outstanding Balance
$127,513
Interest Rate
5.19%
Mortgage Type
Purchase Money Mortgage
Estimated Equity
$618,375
Purchase Details
Closed on
Mar 23, 2003
Sold by
Waugh Gerald Edward
Bought by
Potter Tim and Potter Melissa
Purchase Details
Closed on
Mar 25, 1996
Sold by
Waugh Edward H
Bought by
Petrelis Virginia Ann and Waugh Gerald Edward
Create a Home Valuation Report for This Property
The Home Valuation Report is an in-depth analysis detailing your home's value as well as a comparison with similar homes in the area
Home Values in the Area
Average Home Value in this Area
Purchase History
| Date | Buyer | Sale Price | Title Company |
|---|---|---|---|
| Reiss Andrew W | $299,000 | Chicago Title Company | |
| Potter Tim | $41,500 | Chicago Title Co | |
| Potter Tim | $41,500 | Chicago Title Co | |
| Petrelis Virginia Ann | -- | -- |
Source: Public Records
Mortgage History
| Date | Status | Borrower | Loan Amount |
|---|---|---|---|
| Open | Reiss Andrew W | $199,900 |
Source: Public Records
Tax History
| Year | Tax Paid | Tax Assessment Tax Assessment Total Assessment is a certain percentage of the fair market value that is determined by local assessors to be the total taxable value of land and additions on the property. | Land | Improvement |
|---|---|---|---|---|
| 2025 | $5,374 | $407,092 | $96,550 | $310,542 |
| 2024 | $5,054 | $399,110 | $94,657 | $304,453 |
| 2023 | $5,000 | $391,284 | $92,801 | $298,483 |
| 2022 | $4,893 | $383,611 | $90,981 | $292,630 |
| 2021 | $4,810 | $376,089 | $89,197 | $286,892 |
| 2020 | $4,755 | $372,232 | $88,282 | $283,950 |
| 2019 | $4,669 | $364,933 | $86,551 | $278,382 |
| 2018 | $4,433 | $357,778 | $84,854 | $272,924 |
| 2017 | $4,362 | $332,763 | $83,190 | $249,573 |
| 2016 | $4,116 | $326,238 | $81,559 | $244,679 |
| 2015 | $4,070 | $321,338 | $80,334 | $241,004 |
| 2014 | $3,861 | $302,500 | $61,000 | $241,500 |
Source: Public Records
Map
Nearby Homes
- 8248 Baldy Mesa Rd
- 8384 Highland Ct Unit 201
- 8289 Alta Mesa Rd
- 8605 Cantel Ct
- 8249 Beaver Ave
- 8195 Alta Mesa Rd
- 8695 Cantel Ct
- 0 Braceo St Unit SW25261281
- 8135 Joshua St
- 8121 Anaconda Ave
- 9875 Braceo St
- 1 Mesquite St
- 7925 Anaconda Ave
- 9177 Taylor Way
- 0 Joshua Rd Unit IG25192121
- 0 Joshua Rd Unit HD24075815
- 9176 Arrowhead Rd
- 7877 Capelin Rd
- 0 Capelin Rd Unit IG26000516
- 7786 Capelin Rd
- 8433 Cedar Ct
- 8472 Cedar Ct
- 8448 Cedar Ct
- 8546 Baldy Mesa Rd
- 8424 Cedar Ct
- 9727 Cedar St
- 8471 Arrowhead Rd
- 8431 Baldy Mesa Rd
- 9742 Cedar St
- 8453 Baldy Mesa Rd
- 8423 Arrowhead Rd Unit 201
- 8423 Arrowhead Rd
- 8423 Arrowhead (Paved)
- 8393 Arrowhead Rd
- 9749 Cedar St
- 9564 Arrowhead Ct
- 9771 Cedar St
- 8422 Arrowhead Rd
- 9522 Arrowhead Ct
- 9755 Elm St
Your Personal Tour Guide
Ask me questions while you tour the home.