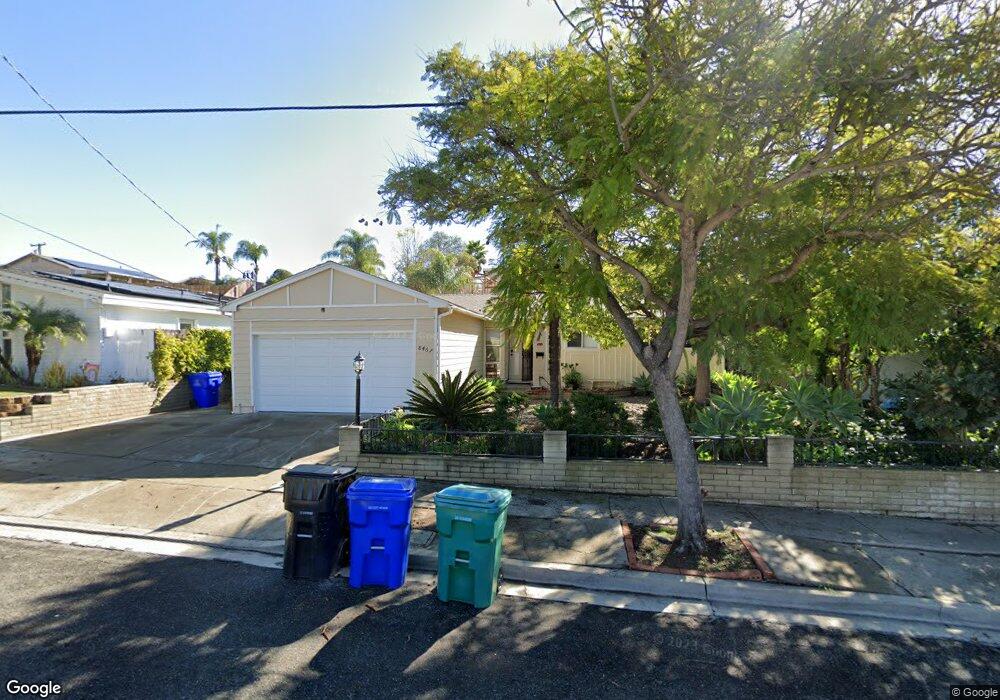
8467 Harwell Dr San Diego, CA 92119
Lake Murray NeighborhoodEstimated Value: $1,178,705 - $1,284,000
4
Beds
3
Baths
1,866
Sq Ft
$662/Sq Ft
Est. Value
About This Home
This home is located at 8467 Harwell Dr, San Diego, CA 92119 and is currently estimated at $1,235,926, approximately $662 per square foot. 8467 Harwell Dr is a home located in San Diego County with nearby schools including Gage Elementary School, Pershing Middle School, and Patrick Henry High School.
Ownership History
Date
Name
Owned For
Owner Type
Purchase Details
Closed on
Dec 4, 2017
Sold by
Oren Eyal and Winkler Jennifer L
Bought by
Oren Eyal and Winkler Jennifer L
Current Estimated Value
Purchase Details
Closed on
Jun 6, 2017
Sold by
Keilani Nabil and Keilani Nadia Jamil
Bought by
Winkler Jennifer L and Oren Eyal
Home Financials for this Owner
Home Financials are based on the most recent Mortgage that was taken out on this home.
Original Mortgage
$533,600
Outstanding Balance
$442,990
Interest Rate
3.95%
Mortgage Type
New Conventional
Estimated Equity
$792,936
Purchase Details
Closed on
Mar 2, 2015
Sold by
Keilani Nabil and Keilani Nadia
Bought by
Keilani Nabil and Fami Nadia Jamil Keilani
Purchase Details
Closed on
Jun 28, 2001
Sold by
Keilani Nabil
Bought by
Keilani Nabil and Keilani Nadia
Home Financials for this Owner
Home Financials are based on the most recent Mortgage that was taken out on this home.
Original Mortgage
$250,000
Interest Rate
7.24%
Mortgage Type
Balloon
Purchase Details
Closed on
Jan 25, 1985
Create a Home Valuation Report for This Property
The Home Valuation Report is an in-depth analysis detailing your home's value as well as a comparison with similar homes in the area
Home Values in the Area
Average Home Value in this Area
Purchase History
| Date | Buyer | Sale Price | Title Company |
|---|---|---|---|
| Oren Eyal | -- | None Available | |
| Winkler Jennifer L | $692,500 | Title365 Company | |
| Keilani Nabil | -- | None Available | |
| Keilani Nabil | -- | Chicago Title Co | |
| -- | $86,000 | -- |
Source: Public Records
Mortgage History
| Date | Status | Borrower | Loan Amount |
|---|---|---|---|
| Open | Winkler Jennifer L | $533,600 | |
| Previous Owner | Keilani Nabil | $250,000 |
Source: Public Records
Tax History Compared to Growth
Tax History
| Year | Tax Paid | Tax Assessment Tax Assessment Total Assessment is a certain percentage of the fair market value that is determined by local assessors to be the total taxable value of land and additions on the property. | Land | Improvement |
|---|---|---|---|---|
| 2025 | $9,592 | $787,942 | $500,643 | $287,299 |
| 2024 | $9,592 | $772,493 | $490,827 | $281,666 |
| 2023 | $9,411 | $757,347 | $481,203 | $276,144 |
| 2022 | $9,160 | $742,498 | $471,768 | $270,730 |
| 2021 | $9,093 | $727,940 | $462,518 | $265,422 |
| 2020 | $8,985 | $720,477 | $457,776 | $262,701 |
| 2019 | $8,823 | $706,350 | $448,800 | $257,550 |
| 2018 | $8,246 | $692,500 | $440,000 | $252,500 |
| 2017 | $2,264 | $187,111 | $69,988 | $117,123 |
| 2016 | $2,227 | $183,443 | $68,616 | $114,827 |
| 2015 | $2,194 | $180,689 | $67,586 | $113,103 |
| 2014 | $2,155 | $177,151 | $66,263 | $110,888 |
Source: Public Records
Map
Nearby Homes
- 8462 Harwell Dr
- 8447 Harwell Dr
- 8402 Boulder Place
- 7111 Barker Way
- 7142 Bobhird Dr
- 8419 Hudson Dr
- 6802 Maury Dr
- 6750 Cowles Mountain Blvd
- 8815 Jackie Dr
- 8774 Tommy Dr
- 9254 Lake Murray Blvd Unit B
- 9411 Lake Murray Blvd Unit B
- 8343 San Carlos Dr
- 7622 Rainswept Ln Unit 134
- 8735 Navajo Rd Unit 8
- 8767 Navajo Rd Unit 12
- 6548 Bantam Lake Cir
- 8717 Navajo Rd Unit 1
- 8765 Lake Murray Blvd Unit 3
- 8765 Lake Murray Blvd Unit 11
- 8463 Harwell Dr
- 8473 Harwell Dr
- 8457 Harwell Dr
- 8477 Harwell Dr
- 8464 Jackie Dr
- 8468 Jackie Dr
- 8458 Jackie Dr
- 6974 Coleshill Dr
- 6964 Coleshill Dr
- 8474 Jackie Dr
- 8483 Harwell Dr
- 8453 Harwell Dr
- 8454 Jackie Dr
- 8466 Harwell Dr
- 8472 Harwell Dr
- 8448 Jackie Dr
- 8476 Harwell Dr
- 8456 Harwell Dr
- 8478 Harwell Dr
- 8482 Harwell Dr