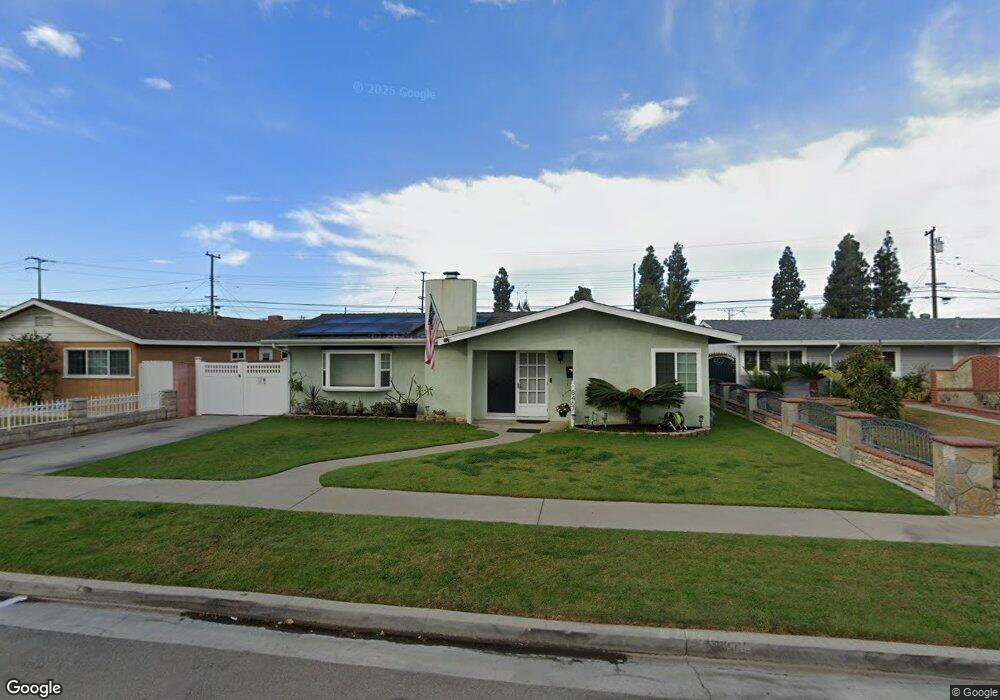
8467 San Clemente Way Buena Park, CA 90620
Estimated Value: $880,000 - $964,000
4
Beds
2
Baths
1,344
Sq Ft
$681/Sq Ft
Est. Value
About This Home
This home is located at 8467 San Clemente Way, Buena Park, CA 90620 and is currently estimated at $915,807, approximately $681 per square foot. 8467 San Clemente Way is a home located in Orange County with nearby schools including Buena Terra Elementary School, Walker Junior High School, and John F. Kennedy High School.
Ownership History
Date
Name
Owned For
Owner Type
Purchase Details
Closed on
Sep 19, 2025
Sold by
Blood John R and Blood Milagros
Bought by
John Richard Blood And Milagros Cecilia Blood and Blood
Current Estimated Value
Purchase Details
Closed on
Nov 13, 2004
Sold by
Brady Michael J and Brady Patricia A
Bought by
Blood John R and Blood Milagros
Home Financials for this Owner
Home Financials are based on the most recent Mortgage that was taken out on this home.
Original Mortgage
$373,600
Interest Rate
5.5%
Mortgage Type
Purchase Money Mortgage
Purchase Details
Closed on
Aug 28, 2003
Sold by
Brady Michael J and Brady Patricia A
Bought by
Brady Michael J and Brady Patricia A
Purchase Details
Closed on
Dec 27, 2001
Sold by
Wettmarshausen Juanita T
Bought by
Brady Michael J and Brady Patricia A
Purchase Details
Closed on
Nov 6, 2001
Sold by
Wettmarshausen Russell D and Wettmarshausen Linda
Bought by
Wettmarshausen Juanita T
Create a Home Valuation Report for This Property
The Home Valuation Report is an in-depth analysis detailing your home's value as well as a comparison with similar homes in the area
Home Values in the Area
Average Home Value in this Area
Purchase History
| Date | Buyer | Sale Price | Title Company |
|---|---|---|---|
| John Richard Blood And Milagros Cecilia Blood | -- | None Listed On Document | |
| Blood John R | $467,000 | Equity Title Company | |
| Brady Michael J | -- | -- | |
| Brady Michael J | $85,000 | -- | |
| Wettmarshausen Juanita T | $84,500 | -- |
Source: Public Records
Mortgage History
| Date | Status | Borrower | Loan Amount |
|---|---|---|---|
| Previous Owner | Blood John R | $373,600 | |
| Closed | Blood John R | $93,400 |
Source: Public Records
Tax History Compared to Growth
Tax History
| Year | Tax Paid | Tax Assessment Tax Assessment Total Assessment is a certain percentage of the fair market value that is determined by local assessors to be the total taxable value of land and additions on the property. | Land | Improvement |
|---|---|---|---|---|
| 2025 | $7,378 | $650,947 | $578,828 | $72,119 |
| 2024 | $7,378 | $638,184 | $567,479 | $70,705 |
| 2023 | $7,196 | $625,671 | $556,352 | $69,319 |
| 2022 | $7,108 | $613,403 | $545,443 | $67,960 |
| 2021 | $7,006 | $601,376 | $534,748 | $66,628 |
| 2020 | $6,959 | $594,660 | $529,265 | $65,395 |
| 2019 | $6,781 | $583,000 | $518,888 | $64,112 |
| 2018 | $6,461 | $554,000 | $498,739 | $55,261 |
| 2017 | $6,374 | $554,000 | $498,739 | $55,261 |
| 2016 | $5,997 | $520,000 | $466,164 | $53,836 |
| 2015 | $5,340 | $458,832 | $404,996 | $53,836 |
| 2014 | $5,165 | $458,832 | $404,996 | $53,836 |
Source: Public Records
Map
Nearby Homes
- 8456 San Clemente Way
- 8623 Valley View St
- 5835 Los Santos Way
- 5921 Los Ramos Cir
- 5837 Los Arcos Way
- 6191 San Ramon Way
- 8757 Los Altos Dr
- 5612 Sprague Ave
- 5671 Vonnie Ln
- 5572 Saint Ann Ave
- 6507 San Alano Cir
- 5493 Twin Lakes Dr
- 5485 Twin Lakes Dr Unit 8
- 17 Citrus Glen
- 5201 La Luna Dr
- 5166 Banbury Cir
- 7571 San Rafael Dr
- 8072 San Hilario Cir
- 7837 La Costa Cir
- 5212 Lena Dr
- 8463 San Clemente Way
- 8471 San Clemente Way
- 8432 Valley View St
- 8422 Valley View St
- 8442 Valley View St
- 8475 San Clemente Way
- 8468 San Clemente Way
- 8412 Valley View St
- 8452 Valley View St
- 8472 San Clemente Way
- 8464 San Clemente Way
- 8479 San Clemente Way
- 8455 San Clemente Way
- 8476 San Clemente Way
- 8460 San Clemente Way
- 8402 Valley View St
- 8462 Valley View St
- 8480 San Clemente Way
- 8483 San Clemente Way