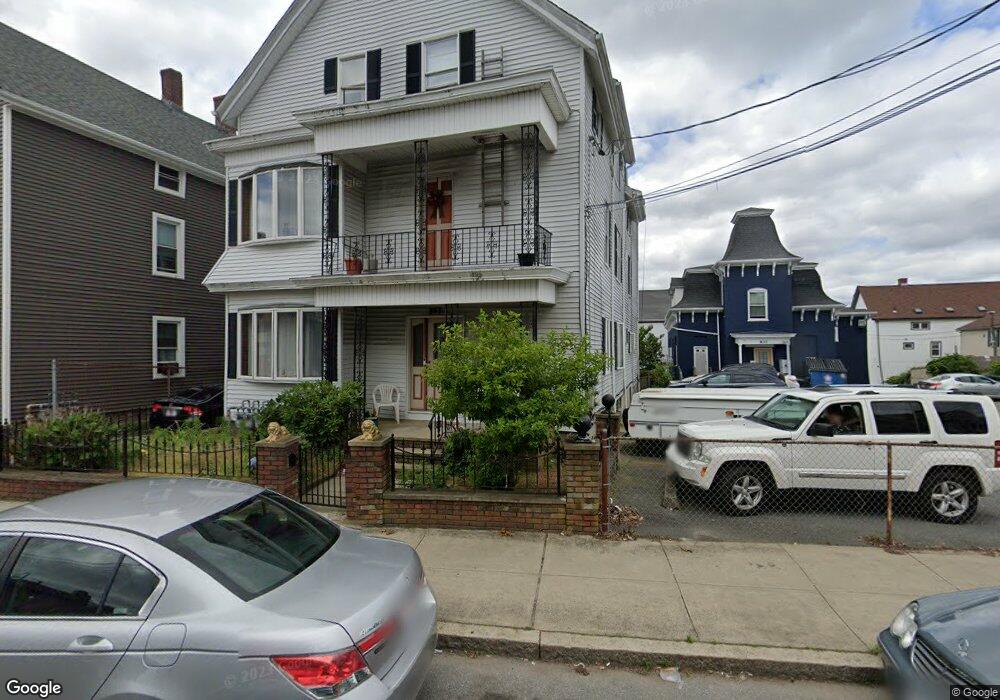
847 2nd St Fall River, MA 02721
Corky Row NeighborhoodEstimated Value: $639,000 - $685,000
9
Beds
3
Baths
3,801
Sq Ft
$176/Sq Ft
Est. Value
About This Home
This home is located at 847 2nd St, Fall River, MA 02721 and is currently estimated at $668,000, approximately $175 per square foot. 847 2nd St is a home located in Bristol County with nearby schools including Henry Lord Community School, B M C Durfee High School, and Argosy Collegiate Charter School.
Ownership History
Date
Name
Owned For
Owner Type
Purchase Details
Closed on
Jan 4, 2024
Sold by
Pinto Sandra M and Botelho Isabel
Bought by
Pinto Sandra M and Botelho Isabel
Current Estimated Value
Home Financials for this Owner
Home Financials are based on the most recent Mortgage that was taken out on this home.
Original Mortgage
$210,000
Outstanding Balance
$205,814
Interest Rate
7.29%
Mortgage Type
Stand Alone Refi Refinance Of Original Loan
Estimated Equity
$462,186
Purchase Details
Closed on
Jul 17, 2021
Sold by
Botelho John
Bought by
Pinto Sandra and Barbosa Isabel
Purchase Details
Closed on
Jun 4, 2021
Sold by
Botelho Maria L
Bought by
Botelho John
Purchase Details
Closed on
Sep 16, 1977
Bought by
Botelho Jose and Botelho Mary
Create a Home Valuation Report for This Property
The Home Valuation Report is an in-depth analysis detailing your home's value as well as a comparison with similar homes in the area
Home Values in the Area
Average Home Value in this Area
Purchase History
| Date | Buyer | Sale Price | Title Company |
|---|---|---|---|
| Pinto Sandra M | -- | None Available | |
| Pinto Sandra M | -- | None Available | |
| Pinto Sandra | -- | None Available | |
| Pinto Sandra | -- | None Available | |
| Botelho John | -- | None Available | |
| Botelho John | -- | None Available | |
| Botelho Jose | $22,000 | -- |
Source: Public Records
Mortgage History
| Date | Status | Borrower | Loan Amount |
|---|---|---|---|
| Open | Pinto Sandra M | $210,000 | |
| Closed | Pinto Sandra M | $210,000 | |
| Previous Owner | Botelho Jose | $27,066 | |
| Previous Owner | Botelho Jose | $12,518 |
Source: Public Records
Tax History
| Year | Tax Paid | Tax Assessment Tax Assessment Total Assessment is a certain percentage of the fair market value that is determined by local assessors to be the total taxable value of land and additions on the property. | Land | Improvement |
|---|---|---|---|---|
| 2025 | $5,608 | $489,800 | $105,600 | $384,200 |
| 2024 | $5,365 | $466,900 | $101,700 | $365,200 |
| 2023 | $4,784 | $389,900 | $84,100 | $305,800 |
| 2022 | $4,243 | $336,200 | $80,100 | $256,100 |
| 2021 | $4,000 | $289,200 | $76,200 | $213,000 |
| 2020 | $3,588 | $248,300 | $75,100 | $173,200 |
| 2019 | $3,052 | $209,300 | $72,300 | $137,000 |
| 2018 | $2,937 | $200,900 | $78,300 | $122,600 |
| 2017 | $2,761 | $197,200 | $74,600 | $122,600 |
| 2016 | $2,710 | $198,800 | $79,400 | $119,400 |
| 2015 | $2,600 | $198,800 | $79,400 | $119,400 |
| 2014 | $2,619 | $208,200 | $77,100 | $131,100 |
Source: Public Records
Map
Nearby Homes
- 857 2nd St
- 857 2nd St Unit 1
- 857 2nd St Unit 2
- 857 Second St Unit 3
- 000 Second St Unit 1
- 578 Osborn St
- 875 2nd St
- 846 2nd St
- 838 2nd St
- 837 2nd St
- 581 Osborn St
- 887 Plymouth Ave
- 566 Osborn St
- 566 Osborn St Unit 3
- 887 2nd St
- 556 Osborn St
- 556-560 Oborn St
- 828 2nd St
- 573 Osborn St
- 875 Plymouth Ave Unit 2
Your Personal Tour Guide
Ask me questions while you tour the home.