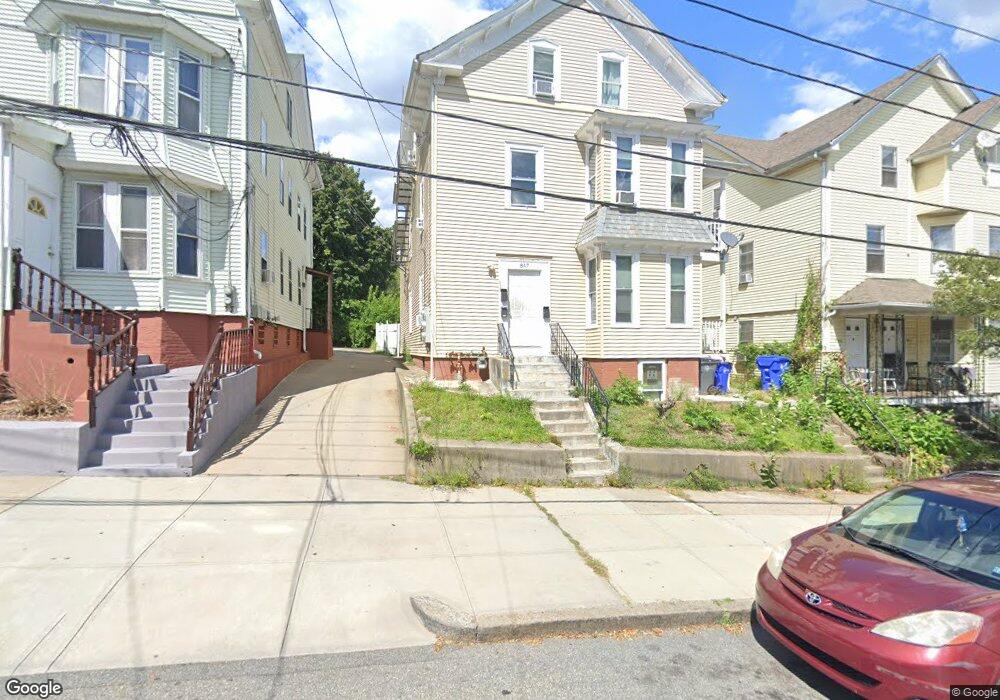
847 Atwells Ave Providence, RI 02909
Mount Pleasant NeighborhoodEstimated Value: $484,084 - $693,000
8
Beds
3
Baths
3,039
Sq Ft
$199/Sq Ft
Est. Value
About This Home
This home is located at 847 Atwells Ave, Providence, RI 02909 and is currently estimated at $606,271, approximately $199 per square foot. 847 Atwells Ave is a home located in Providence County with nearby schools including Asa Messer Elementary School, Charles N. Fortes Elementary School, and Laurel Hill Annex School.
Ownership History
Date
Name
Owned For
Owner Type
Purchase Details
Closed on
Oct 31, 2019
Sold by
Silva Rosa Property Mgmt
Bought by
Dasilva-Oliveira Rosilda and Oliveira Rosilda
Current Estimated Value
Home Financials for this Owner
Home Financials are based on the most recent Mortgage that was taken out on this home.
Original Mortgage
$272,588
Outstanding Balance
$239,529
Interest Rate
3.65%
Mortgage Type
FHA
Estimated Equity
$366,742
Purchase Details
Closed on
Nov 21, 2017
Sold by
Dth Reo Inc
Bought by
Silva Rosa Property Mg
Home Financials for this Owner
Home Financials are based on the most recent Mortgage that was taken out on this home.
Original Mortgage
$128,000
Interest Rate
3.85%
Mortgage Type
Future Advance Clause Open End Mortgage
Purchase Details
Closed on
Feb 11, 2016
Sold by
Neves Christine and Deutsche Bk Natl T Co
Bought by
Deutsche Bk Natl T Co
Purchase Details
Closed on
Feb 27, 2015
Sold by
Reisch Norman and Providence City Of
Bought by
Neves Christine
Create a Home Valuation Report for This Property
The Home Valuation Report is an in-depth analysis detailing your home's value as well as a comparison with similar homes in the area
Home Values in the Area
Average Home Value in this Area
Purchase History
| Date | Buyer | Sale Price | Title Company |
|---|---|---|---|
| Dasilva-Oliveira Rosilda | $282,000 | -- | |
| Silva Rosa Property Mg | $48,000 | -- | |
| Deutsche Bk Natl T Co | $359,766 | -- | |
| Neves Christine | $2,534 | -- |
Source: Public Records
Mortgage History
| Date | Status | Borrower | Loan Amount |
|---|---|---|---|
| Open | Dasilva-Oliveira Rosilda | $272,588 | |
| Previous Owner | Silva Rosa Property Mg | $128,000 |
Source: Public Records
Tax History Compared to Growth
Tax History
| Year | Tax Paid | Tax Assessment Tax Assessment Total Assessment is a certain percentage of the fair market value that is determined by local assessors to be the total taxable value of land and additions on the property. | Land | Improvement |
|---|---|---|---|---|
| 2025 | $4,014 | $531,700 | $128,000 | $403,700 |
| 2024 | $5,523 | $301,000 | $74,000 | $227,000 |
| 2023 | $5,523 | $301,000 | $74,000 | $227,000 |
| 2022 | $5,358 | $301,000 | $74,000 | $227,000 |
| 2021 | $4,561 | $185,700 | $51,900 | $133,800 |
| 2020 | $4,561 | $185,700 | $51,900 | $133,800 |
| 2019 | $4,561 | $185,700 | $51,900 | $133,800 |
| 2018 | $2,579 | $80,700 | $33,300 | $47,400 |
| 2017 | $3,340 | $104,500 | $33,300 | $71,200 |
| 2016 | $2,579 | $80,700 | $33,300 | $47,400 |
| 2015 | $2,688 | $81,200 | $44,400 | $36,800 |
| 2014 | $2,741 | $81,200 | $44,400 | $36,800 |
| 2013 | $2,741 | $81,200 | $44,400 | $36,800 |
Source: Public Records
Map
Nearby Homes
- 851 Atwells Ave
- 841 Atwells Ave
- 855 Atwells Ave
- 837 Atwells Ave
- 44 Cambridge St
- 835 Atwells Ave
- 853 Atwells Ave
- 857 Atwells Ave
- 38 Cambridge St
- 54 Cambridge St
- 850 Atwells Ave
- 848 Atwells Ave
- 831 Atwells Ave
- 32 Cambridge St
- 13 Sears Ave
- 829 Atwells Ave
- 840 Atwells Ave Unit 3 West
- 840 Atwells Ave
- 840 Atwells Ave Unit 1-East
- 840 Atwells Ave