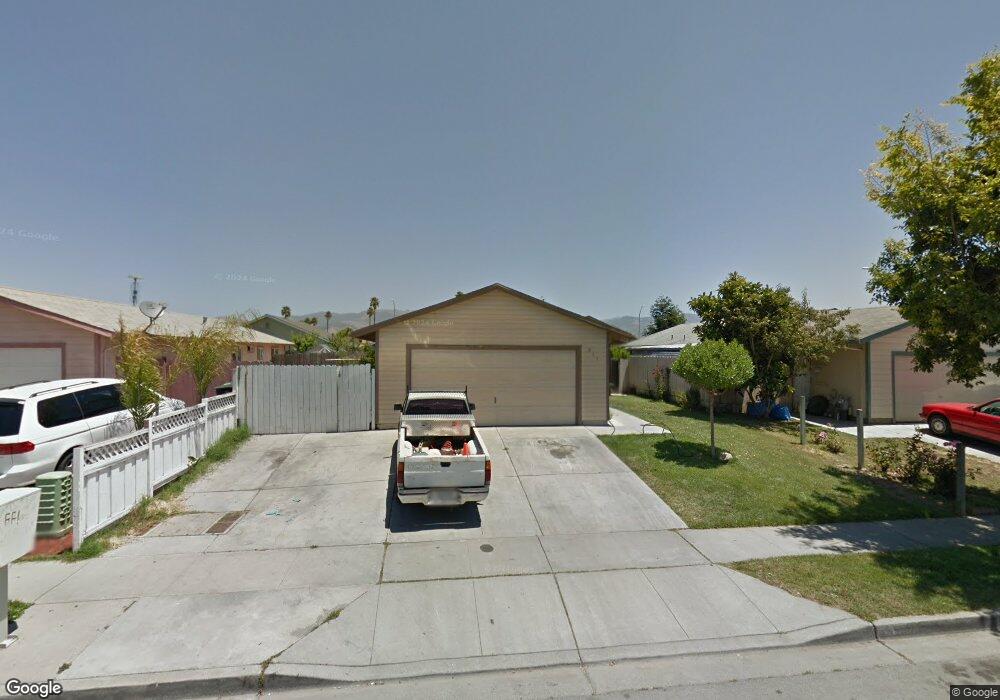
847 Bermuda Way Salinas, CA 93905
East Salinas NeighborhoodEstimated Value: $573,000 - $707,000
3
Beds
2
Baths
1,287
Sq Ft
$486/Sq Ft
Est. Value
About This Home
This home is located at 847 Bermuda Way, Salinas, CA 93905 and is currently estimated at $625,424, approximately $485 per square foot. 847 Bermuda Way is a home located in Monterey County with nearby schools including Frank Paul Elementary School, La Paz Middle School, and Alisal High School.
Ownership History
Date
Name
Owned For
Owner Type
Purchase Details
Closed on
Jul 7, 2020
Sold by
Gonzalez Miguel and Gonzalez Rosalina V
Bought by
Gonzalez Rosalina V
Current Estimated Value
Purchase Details
Closed on
Jun 13, 2001
Sold by
Gonzalez Armando and Gonzalez Rosana O
Bought by
Gonzalez Miguel and Gonzalez Rosalina V
Home Financials for this Owner
Home Financials are based on the most recent Mortgage that was taken out on this home.
Original Mortgage
$128,000
Interest Rate
7.14%
Purchase Details
Closed on
Jan 23, 1998
Sold by
Rider Property Development
Bought by
Gonzalez Armando and Gonzalez Rosana O
Home Financials for this Owner
Home Financials are based on the most recent Mortgage that was taken out on this home.
Original Mortgage
$132,050
Interest Rate
7.13%
Purchase Details
Closed on
Jan 20, 1998
Sold by
Gonzalez Miguel
Bought by
Gonzalez Rosalina V
Home Financials for this Owner
Home Financials are based on the most recent Mortgage that was taken out on this home.
Original Mortgage
$132,050
Interest Rate
7.13%
Create a Home Valuation Report for This Property
The Home Valuation Report is an in-depth analysis detailing your home's value as well as a comparison with similar homes in the area
Home Values in the Area
Average Home Value in this Area
Purchase History
| Date | Buyer | Sale Price | Title Company |
|---|---|---|---|
| Gonzalez Rosalina V | -- | None Available | |
| Gonzalez Miguel | -- | Chicago Title Co | |
| Gonzalez Armando | $139,000 | Stewart Title | |
| Gonzalez Rosalina V | -- | Stewart Title |
Source: Public Records
Mortgage History
| Date | Status | Borrower | Loan Amount |
|---|---|---|---|
| Closed | Gonzalez Miguel | $128,000 | |
| Closed | Gonzalez Armando | $132,050 |
Source: Public Records
Tax History
| Year | Tax Paid | Tax Assessment Tax Assessment Total Assessment is a certain percentage of the fair market value that is determined by local assessors to be the total taxable value of land and additions on the property. | Land | Improvement |
|---|---|---|---|---|
| 2025 | $2,939 | $221,932 | $103,780 | $118,152 |
| 2024 | $2,939 | $217,582 | $101,746 | $115,836 |
| 2023 | $2,885 | $213,316 | $99,751 | $113,565 |
| 2022 | $2,597 | $209,135 | $97,796 | $111,339 |
| 2021 | $2,598 | $205,035 | $95,879 | $109,156 |
| 2020 | $2,570 | $202,933 | $94,896 | $108,037 |
| 2019 | $2,650 | $198,955 | $93,036 | $105,919 |
| 2018 | $2,498 | $195,055 | $91,212 | $103,843 |
| 2017 | $2,592 | $191,231 | $89,424 | $101,807 |
| 2016 | $2,460 | $187,482 | $87,671 | $99,811 |
| 2015 | $2,512 | $184,667 | $86,355 | $98,312 |
| 2014 | $2,351 | $181,051 | $84,664 | $96,387 |
Source: Public Records
Map
Nearby Homes
- 755 Pino Way
- 1046 C St
- 1126 Pacific Ave
- 11 Fresa Place
- 948 Rider Ave
- 1544 Saguaro Dr Unit 4
- 933 Acosta Plaza Unit 35
- 18 Hancock Cir
- 1725 Great Island St
- 11 E Laurel Dr
- 10 Rex Cir
- 11 Hill Cir
- 15 Cheswick Cir
- 609 Saint George Dr
- 544 Saint George Dr
- 1914 Whitman St
- 1858 Bradbury St
- 1849 Bradbury St
- 230 Paloma Ave
- 1671 Cambrian Dr
- 843 Bermuda Way
- 851 Bermuda Way
- 839 Bermuda Way
- 844 Amarillo Way
- 848 Amarillo Way
- 840 Amarillo Way
- 1278 Pacific Ave
- 836 Amarillo Way
- 835 Bermuda Way
- 855 Amarillo Way
- 846 Bermuda Way
- 842 Bermuda Way
- 850 Bermuda Way
- 838 Bermuda Way
- 832 Amarillo Way
- 1262 Pacific Ave
- 1266 Pacific Ave
- 831 Bermuda Way
- 1270 Pacific Ave
- 1258 Pacific Ave
Your Personal Tour Guide
Ask me questions while you tour the home.