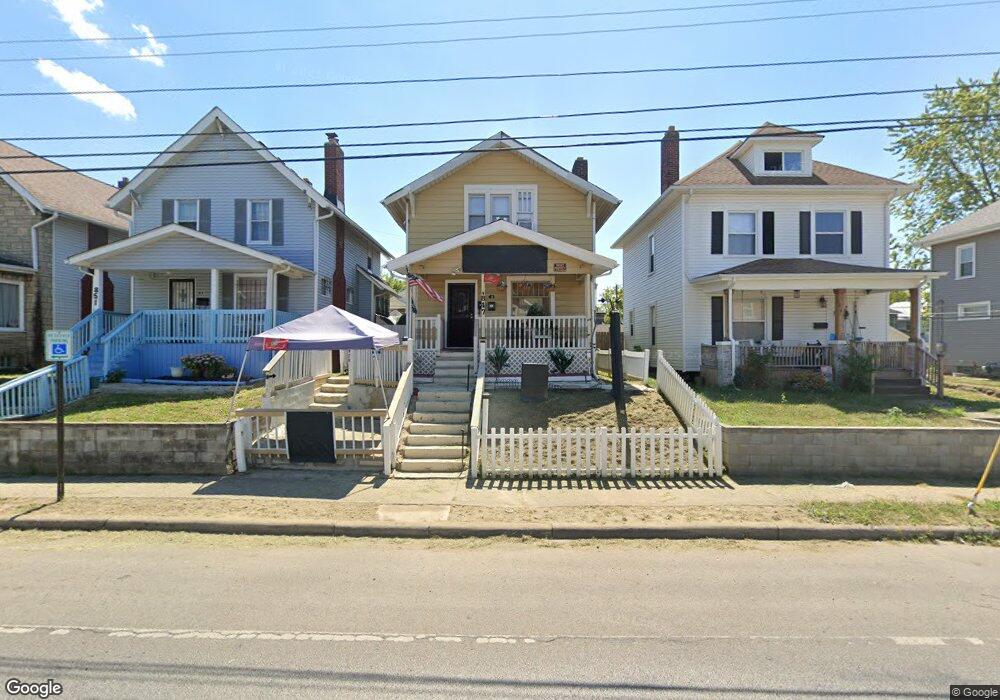
847 E Whittier St Columbus, OH 43206
Karns Park NeighborhoodEstimated Value: $156,055 - $264,000
3
Beds
1
Bath
1,180
Sq Ft
$171/Sq Ft
Est. Value
About This Home
This home is located at 847 E Whittier St, Columbus, OH 43206 and is currently estimated at $201,764, approximately $170 per square foot. 847 E Whittier St is a home located in Franklin County with nearby schools including Livingston Elementary School, South High School, and South Columbus Preparatory Academy.
Ownership History
Date
Name
Owned For
Owner Type
Purchase Details
Closed on
Nov 3, 2008
Sold by
Equity One Inc
Bought by
Mtglq Investors Lp
Current Estimated Value
Purchase Details
Closed on
Jul 6, 2007
Sold by
Rapp William R and Case #06Cve10 13047
Bought by
Equity One Inc
Purchase Details
Closed on
Apr 4, 2001
Sold by
Monroe James L and Monroe Martha A
Bought by
Rapp William R and Rapp Gayle F
Home Financials for this Owner
Home Financials are based on the most recent Mortgage that was taken out on this home.
Original Mortgage
$17,600
Interest Rate
7.13%
Purchase Details
Closed on
Nov 2, 1982
Bought by
Monroe James L
Purchase Details
Closed on
Mar 1, 1979
Create a Home Valuation Report for This Property
The Home Valuation Report is an in-depth analysis detailing your home's value as well as a comparison with similar homes in the area
Home Values in the Area
Average Home Value in this Area
Purchase History
| Date | Buyer | Sale Price | Title Company |
|---|---|---|---|
| Mtglq Investors Lp | -- | Foundatio | |
| Equity One Inc | $24,000 | Foundation | |
| Rapp William R | $17,600 | -- | |
| Monroe James L | -- | -- | |
| -- | $17,400 | -- |
Source: Public Records
Mortgage History
| Date | Status | Borrower | Loan Amount |
|---|---|---|---|
| Previous Owner | Rapp William R | $17,600 |
Source: Public Records
Tax History
| Year | Tax Paid | Tax Assessment Tax Assessment Total Assessment is a certain percentage of the fair market value that is determined by local assessors to be the total taxable value of land and additions on the property. | Land | Improvement |
|---|---|---|---|---|
| 2025 | $5,418 | $61,610 | $17,400 | $44,210 |
| 2024 | $5,418 | $61,610 | $17,400 | $44,210 |
| 2023 | $2,788 | $61,600 | $17,395 | $44,205 |
| 2022 | $1,101 | $20,720 | $4,200 | $16,520 |
| 2021 | $1,103 | $20,720 | $4,200 | $16,520 |
| 2020 | $1,147 | $20,720 | $4,200 | $16,520 |
| 2019 | $1,155 | $17,890 | $3,220 | $14,670 |
| 2018 | $1,151 | $17,890 | $3,220 | $14,670 |
| 2017 | $1,211 | $17,890 | $3,220 | $14,670 |
| 2016 | $1,352 | $8,970 | $2,770 | $6,200 |
| 2015 | $1,137 | $8,970 | $2,770 | $6,200 |
| 2014 | $556 | $8,970 | $2,770 | $6,200 |
| 2013 | $288 | $9,415 | $2,905 | $6,510 |
Source: Public Records
Map
Nearby Homes
- 883 E Whittier St
- 000 Gilbert St
- 00 Gilbert St
- 999 S 22nd St
- 779-781 Stanley Ave
- 1064 Heyl Ave
- 960 Carpenter St
- 735 Reinhard Ave
- 941-945 E Whittier St
- 932 Wagner St
- 1174-1176 S 22nd St
- 935 S Ohio Ave
- 1088 S Champion Ave
- 987 E Whittier St
- 664 Siebert St
- 901 Heyl Ave
- 1196 S Ohio Ave
- 1146 S Champion Ave Unit 1148
- 870 Gilbert St
- 1226-1228 Gilbert St
- 843 E Whittier St
- 851 E Whittier St
- 855 E Whittier St
- 837 E Whittier St
- 859 E Whittier St
- 833 E Whittier St
- 844 Reinhard Ave
- 0 E Whittier St Unit L149
- 840 Reinhard Ave
- 846 Reinhard Ave Unit 848
- 846-848 Reinhard Ave
- 867 E Whittier St
- 829 E Whittier St
- 1061 S 22nd St
- 840-840 E Whittier St
- 828 Reinhard Ave
- 854 E Whittier St
- 826 Reinhard Ave
- 825 E Whittier St
- 836 E Whittier St
Your Personal Tour Guide
Ask me questions while you tour the home.