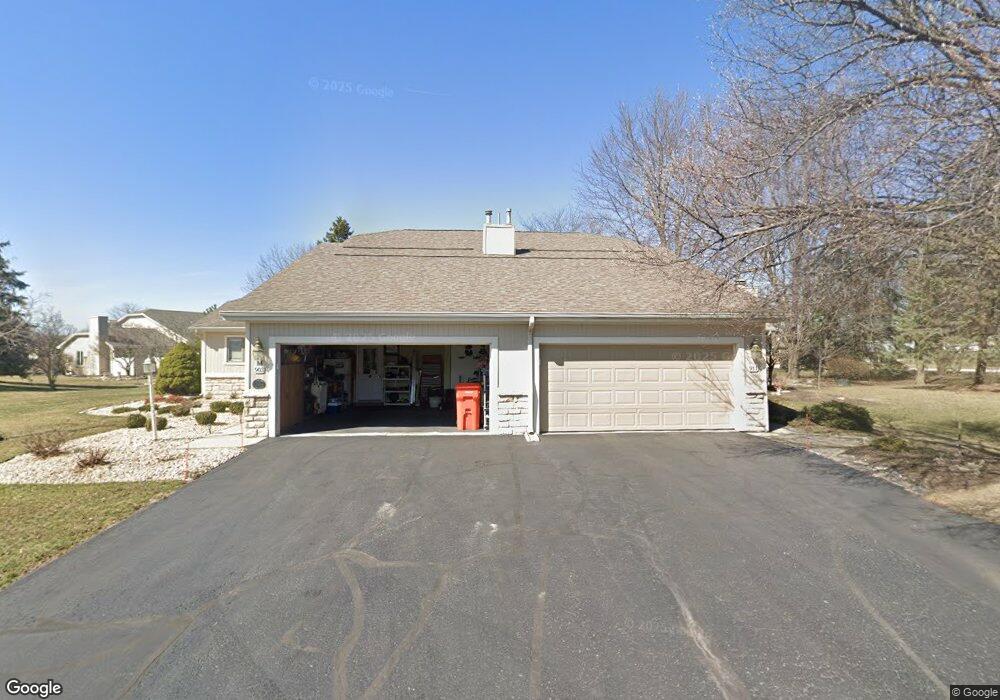
847 Fox Run Rd Unit 2 Findlay, OH 45840
Estimated Value: $208,000 - $245,000
2
Beds
2
Baths
1,328
Sq Ft
$168/Sq Ft
Est. Value
About This Home
This home is located at 847 Fox Run Rd Unit 2, Findlay, OH 45840 and is currently estimated at $223,463, approximately $168 per square foot. 847 Fox Run Rd Unit 2 is a home located in Hancock County with nearby schools including Wilson Vance Elementary School, Whittier Elementary School, and Glenwood Middle School.
Ownership History
Date
Name
Owned For
Owner Type
Purchase Details
Closed on
May 27, 2022
Sold by
Koehler James C
Bought by
Investek Holdings Llc
Current Estimated Value
Purchase Details
Closed on
Mar 6, 2017
Sold by
Mcnish Crista K and Simmers Crista K
Bought by
Koehler James C and Koehler Brothers
Purchase Details
Closed on
Jul 7, 2005
Sold by
Robinson William J and Robinson Sally L
Bought by
Simmers Crista K
Home Financials for this Owner
Home Financials are based on the most recent Mortgage that was taken out on this home.
Original Mortgage
$106,400
Interest Rate
5.75%
Mortgage Type
Fannie Mae Freddie Mac
Purchase Details
Closed on
Oct 11, 2000
Sold by
Abbey Ingrid P
Bought by
Robinson William J and Robinson Sally L
Purchase Details
Closed on
Dec 14, 1992
Bought by
Cooper Bennie J and Cooper Dorothy
Purchase Details
Closed on
May 6, 1983
Bought by
Jackson Margaret P
Purchase Details
Closed on
May 11, 1982
Bought by
Jackson Charles A
Purchase Details
Closed on
Nov 24, 1981
Bought by
Country Club Acres Inc
Create a Home Valuation Report for This Property
The Home Valuation Report is an in-depth analysis detailing your home's value as well as a comparison with similar homes in the area
Home Values in the Area
Average Home Value in this Area
Purchase History
| Date | Buyer | Sale Price | Title Company |
|---|---|---|---|
| Investek Holdings Llc | -- | None Listed On Document | |
| Koehler James C | -- | None Available | |
| Simmers Crista K | $133,000 | Golden Key Title Agency | |
| Robinson William J | $120,000 | -- | |
| Cooper Bennie J | $94,500 | -- | |
| Jackson Margaret P | -- | -- | |
| Jackson Charles A | $66,000 | -- | |
| Country Club Acres Inc | -- | -- |
Source: Public Records
Mortgage History
| Date | Status | Borrower | Loan Amount |
|---|---|---|---|
| Previous Owner | Simmers Crista K | $106,400 |
Source: Public Records
Tax History Compared to Growth
Tax History
| Year | Tax Paid | Tax Assessment Tax Assessment Total Assessment is a certain percentage of the fair market value that is determined by local assessors to be the total taxable value of land and additions on the property. | Land | Improvement |
|---|---|---|---|---|
| 2024 | $2,147 | $58,890 | $3,680 | $55,210 |
| 2023 | $2,150 | $58,890 | $3,680 | $55,210 |
| 2022 | $2,143 | $58,890 | $3,680 | $55,210 |
| 2021 | $2,167 | $51,870 | $2,800 | $49,070 |
| 2020 | $2,166 | $51,870 | $2,800 | $49,070 |
| 2019 | $2,126 | $51,870 | $2,800 | $49,070 |
| 2018 | $1,997 | $44,740 | $2,800 | $41,940 |
| 2017 | $1,998 | $44,740 | $2,800 | $41,940 |
| 2016 | $1,920 | $44,740 | $2,800 | $41,940 |
| 2015 | $1,748 | $39,980 | $2,800 | $37,180 |
| 2014 | $1,748 | $39,980 | $2,800 | $37,180 |
| 2012 | $1,867 | $42,350 | $2,800 | $39,550 |
Source: Public Records
Map
Nearby Homes
- 801 Fox Run Rd
- 806 Woodstock Ct
- 828 Longmeadow Ln
- 2252 Fox Run Cir
- 822 Bright Rd
- 2000 Rush Creek Ct
- 505 Bright Rd
- 0 Meadowview Dr
- 1926 Queenswood Dr
- 1902 Queenswood Dr
- 1203 Chateau Ct
- 537 Bristol Dr
- 1825 Greendale Ave
- 1364 Chateau Cir Unit 31
- 1364 Chateau Cir Unit 26
- 1303 Chateau Cir Unit 60
- 1901 Imperial Ln
- 1812 Camelot Ln
- 1611 Brand Manor Dr Unit 5
- 1309 Chateau Cir Unit 63
- 845 Fox Run Rd
- 845 Fox Run Rd Unit U-1
- 849 Fox Run Rd Unit 3
- 851 Fox Run Rd Unit U4
- 843 Fox Run Rd
- 843 Fox Run Rd Unit 19
- 853 Fox Run Rd
- 853 Fox Run Rd Unit 18
- 857 Fox Run Rd
- 859 Fox Run Rd Unit U6
- 831 Fox Run Rd Unit U12
- 831 Fox Run Rd Unit U11
- 831 Fox Run Rd Unit U10
- 861 Fox Run Rd
- 863 Fox Run Rd
- 865 Fox Run Rd Unit U9
- 903 Fox Run Rd
- 832 Fox Run Rd
- 848 Fox Run Rd Unit 10
- 821 Fox Run Rd Unit U9