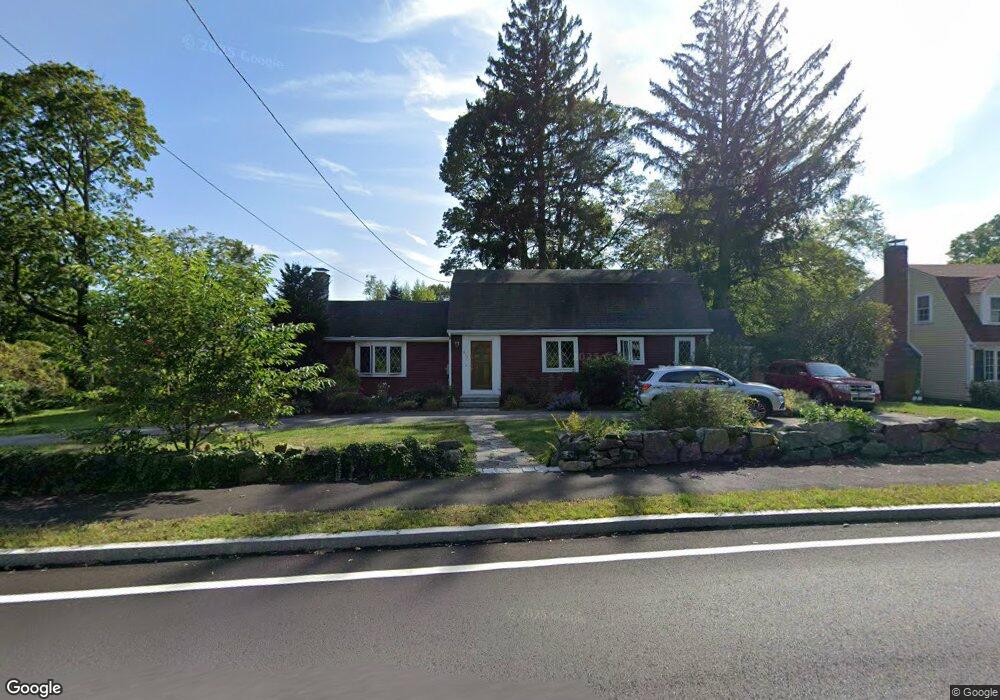
847 Hale St Beverly, MA 01915
Beverly Farms NeighborhoodEstimated Value: $993,345 - $1,194,000
3
Beds
2
Baths
1,896
Sq Ft
$570/Sq Ft
Est. Value
About This Home
This home is located at 847 Hale St, Beverly, MA 01915 and is currently estimated at $1,081,586, approximately $570 per square foot. 847 Hale St is a home located in Essex County with nearby schools including Beverly High School, Glen Urquhart School, and Tara Montessori School.
Ownership History
Date
Name
Owned For
Owner Type
Purchase Details
Closed on
Apr 25, 1997
Sold by
Est Graham Barbara and Whitney Thomas H
Bought by
Nichols Jeffrey C
Current Estimated Value
Purchase Details
Closed on
Jun 30, 1993
Sold by
Noyes Richard
Bought by
Graham Barbara P
Create a Home Valuation Report for This Property
The Home Valuation Report is an in-depth analysis detailing your home's value as well as a comparison with similar homes in the area
Home Values in the Area
Average Home Value in this Area
Purchase History
| Date | Buyer | Sale Price | Title Company |
|---|---|---|---|
| Nichols Jeffrey C | $185,000 | -- | |
| Graham Barbara P | $222,000 | -- |
Source: Public Records
Mortgage History
| Date | Status | Borrower | Loan Amount |
|---|---|---|---|
| Open | Graham Barbara P | $152,000 | |
| Closed | Graham Barbara P | $125,000 | |
| Closed | Graham Barbara P | $140,500 |
Source: Public Records
Tax History
| Year | Tax Paid | Tax Assessment Tax Assessment Total Assessment is a certain percentage of the fair market value that is determined by local assessors to be the total taxable value of land and additions on the property. | Land | Improvement |
|---|---|---|---|---|
| 2025 | $10,006 | $910,500 | $646,200 | $264,300 |
| 2024 | $9,796 | $872,300 | $608,000 | $264,300 |
| 2023 | $9,478 | $841,700 | $577,400 | $264,300 |
| 2022 | $8,381 | $688,700 | $424,400 | $264,300 |
| 2021 | $8,190 | $644,900 | $403,400 | $241,500 |
| 2020 | $7,980 | $622,000 | $380,500 | $241,500 |
| 2019 | $7,748 | $586,500 | $351,800 | $234,700 |
| 2018 | $7,995 | $587,900 | $378,500 | $209,400 |
| 2017 | $7,358 | $515,300 | $305,900 | $209,400 |
| 2016 | $7,415 | $515,300 | $305,900 | $209,400 |
| 2015 | $7,271 | $515,300 | $305,900 | $209,400 |
Source: Public Records
Map
Nearby Homes
Your Personal Tour Guide
Ask me questions while you tour the home.