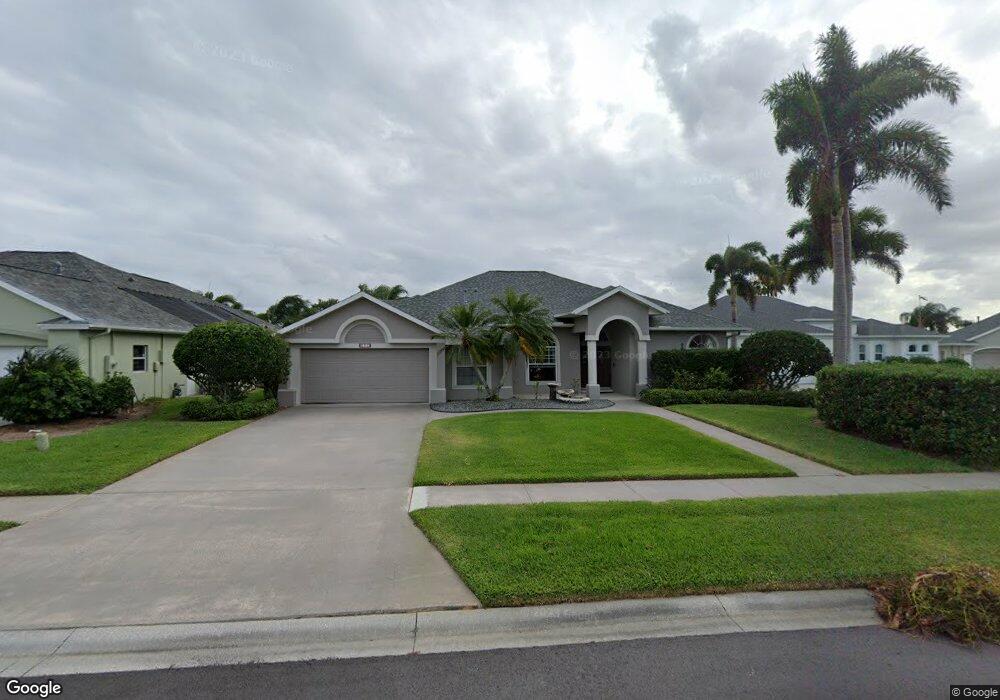
847 Moorhen Ct Rockledge, FL 32955
Estimated Value: $533,610 - $590,000
3
Beds
2
Baths
2,132
Sq Ft
$266/Sq Ft
Est. Value
About This Home
This home is located at 847 Moorhen Ct, Rockledge, FL 32955 and is currently estimated at $567,153, approximately $266 per square foot. 847 Moorhen Ct is a home located in Brevard County with nearby schools including Ralph M. Williams Junior Elementary School, Ronald McNair Magnet Middle School, and Devereux School.
Ownership History
Date
Name
Owned For
Owner Type
Purchase Details
Closed on
Jul 13, 2001
Sold by
Witlin Sanford H and Witlin Barbara T
Bought by
May Michael J and May Nancy A
Current Estimated Value
Home Financials for this Owner
Home Financials are based on the most recent Mortgage that was taken out on this home.
Original Mortgage
$172,400
Outstanding Balance
$66,149
Interest Rate
7.08%
Estimated Equity
$501,004
Purchase Details
Closed on
Jun 16, 1997
Sold by
Viera Co
Bought by
Schull Bldr Inc
Home Financials for this Owner
Home Financials are based on the most recent Mortgage that was taken out on this home.
Original Mortgage
$150,750
Interest Rate
7.93%
Purchase Details
Closed on
Jun 11, 1997
Sold by
Schull Bldr Inc
Bought by
Witlin Sanford H and Witlin Barbara T
Home Financials for this Owner
Home Financials are based on the most recent Mortgage that was taken out on this home.
Original Mortgage
$150,750
Interest Rate
7.93%
Create a Home Valuation Report for This Property
The Home Valuation Report is an in-depth analysis detailing your home's value as well as a comparison with similar homes in the area
Home Values in the Area
Average Home Value in this Area
Purchase History
| Date | Buyer | Sale Price | Title Company |
|---|---|---|---|
| May Michael J | $229,900 | -- | |
| Schull Bldr Inc | $25,900 | -- | |
| Witlin Sanford H | $25,900 | -- |
Source: Public Records
Mortgage History
| Date | Status | Borrower | Loan Amount |
|---|---|---|---|
| Open | May Michael J | $172,400 | |
| Previous Owner | Witlin Sanford H | $150,750 |
Source: Public Records
Tax History Compared to Growth
Tax History
| Year | Tax Paid | Tax Assessment Tax Assessment Total Assessment is a certain percentage of the fair market value that is determined by local assessors to be the total taxable value of land and additions on the property. | Land | Improvement |
|---|---|---|---|---|
| 2025 | $3,321 | $222,730 | -- | -- |
| 2024 | $3,278 | $216,460 | -- | -- |
| 2023 | $3,278 | $210,160 | $0 | $0 |
| 2022 | $3,094 | $204,040 | $0 | $0 |
| 2021 | $3,273 | $198,100 | $0 | $0 |
| 2020 | $3,261 | $195,370 | $0 | $0 |
| 2019 | $3,208 | $190,980 | $0 | $0 |
| 2018 | $3,214 | $187,420 | $0 | $0 |
| 2017 | $3,238 | $183,570 | $0 | $0 |
| 2016 | $3,280 | $179,800 | $60,500 | $119,300 |
| 2015 | $3,347 | $178,560 | $60,500 | $118,060 |
| 2014 | $3,354 | $177,150 | $55,000 | $122,150 |
Source: Public Records
Map
Nearby Homes
- 840 Sandhill Crane Ct
- 1505 Chesapeake Ct
- 1671 Lago Mar Dr
- 1790 Independence Ave
- 1422 Keys Gate Dr
- 1692 Keys Gate Dr
- 1419 Patriot Dr
- 1773 Sun Gazer Dr
- 1464 Timacuan Dr
- 1713 Keys Gate Dr
- 1703 Keys Gate Dr
- 2009 Tullagee Ave
- 1247 Hasley Place
- 1432 Patriot Dr
- 1634 Timacuan Dr
- 1908 Tullagee Ave
- 1440 Patriot Dr
- 1575 Timacuan Dr
- 1685 Timacuan Dr
- 1663 Independence Ave
- 857 Moorhen Ct
- 837 Moorhen Ct
- 5750 Herons Landing Dr
- 867 Moorhen Ct
- 846 Moorhen Ct
- 856 Moorhen Ct
- 836 Moorhen Ct Unit 6A
- 5740 Herons Landing Dr
- 768 Harrier Ct
- 876 Moorhen Ct
- 866 Moorhen Ct
- 767 Harrier Ct
- 5730 Herons Landing Dr
- 5800 Herons Landing Dr
- 5771 Herons Landing Dr
- 764 Harrier Ct
- 5781 Herons Landing Dr
- 5731 Herons Landing Dr
- 763 Harrier Ct
- 5791 Herons Landing Dr