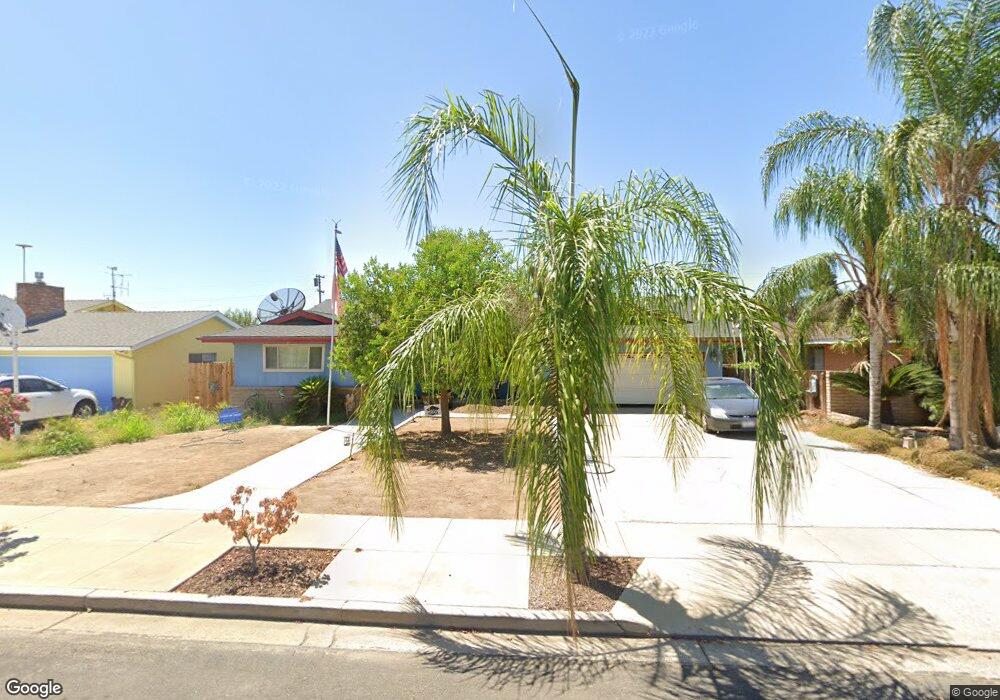
847 N Newton Dr Dinuba, CA 93618
Estimated Value: $343,000 - $448,000
3
Beds
3
Baths
1,660
Sq Ft
$234/Sq Ft
Est. Value
About This Home
This home is located at 847 N Newton Dr, Dinuba, CA 93618 and is currently estimated at $388,951, approximately $234 per square foot. 847 N Newton Dr is a home located in Tulare County with nearby schools including Lincoln Elementary School, Washington Intermediate School, and Dinuba High School.
Ownership History
Date
Name
Owned For
Owner Type
Purchase Details
Closed on
Apr 16, 2020
Sold by
Martinez Ruben and Martinez Diana M
Bought by
Martinez Ruben V and Martinez Diana M
Current Estimated Value
Purchase Details
Closed on
Oct 21, 1998
Sold by
Miller Macci
Bought by
Martinez Diana M and Martinez Ruben
Home Financials for this Owner
Home Financials are based on the most recent Mortgage that was taken out on this home.
Original Mortgage
$68,500
Outstanding Balance
$14,533
Interest Rate
6.54%
Estimated Equity
$374,418
Purchase Details
Closed on
Mar 3, 1998
Sold by
Miller John C
Bought by
Miller John C and Miller Macci
Home Financials for this Owner
Home Financials are based on the most recent Mortgage that was taken out on this home.
Original Mortgage
$31,000
Interest Rate
7.02%
Mortgage Type
Stand Alone Second
Purchase Details
Closed on
Dec 3, 1993
Sold by
Glover William W
Bought by
Miller John C and Gomez Macci
Home Financials for this Owner
Home Financials are based on the most recent Mortgage that was taken out on this home.
Original Mortgage
$109,800
Interest Rate
7.21%
Create a Home Valuation Report for This Property
The Home Valuation Report is an in-depth analysis detailing your home's value as well as a comparison with similar homes in the area
Home Values in the Area
Average Home Value in this Area
Purchase History
| Date | Buyer | Sale Price | Title Company |
|---|---|---|---|
| Martinez Ruben V | -- | None Available | |
| Martinez Diana M | $125,000 | Chicago Title Co | |
| Miller John C | -- | First American Title Ins Co | |
| Miller John C | $122,000 | Chicago Title Company |
Source: Public Records
Mortgage History
| Date | Status | Borrower | Loan Amount |
|---|---|---|---|
| Open | Martinez Diana M | $68,500 | |
| Previous Owner | Miller John C | $31,000 | |
| Previous Owner | Miller John C | $109,800 |
Source: Public Records
Tax History
| Year | Tax Paid | Tax Assessment Tax Assessment Total Assessment is a certain percentage of the fair market value that is determined by local assessors to be the total taxable value of land and additions on the property. | Land | Improvement |
|---|---|---|---|---|
| 2025 | $2,147 | $195,969 | $54,869 | $141,100 |
| 2024 | $2,147 | $192,128 | $53,794 | $138,334 |
| 2023 | $2,125 | $188,362 | $52,740 | $135,622 |
| 2022 | $2,025 | $184,669 | $51,706 | $132,963 |
| 2021 | $1,977 | $181,048 | $50,692 | $130,356 |
| 2020 | $2,008 | $179,191 | $50,172 | $129,019 |
| 2019 | $2,038 | $175,677 | $49,188 | $126,489 |
| 2018 | $1,968 | $172,233 | $48,224 | $124,009 |
| 2017 | $1,960 | $168,855 | $47,278 | $121,577 |
| 2016 | $1,868 | $165,544 | $46,351 | $119,193 |
| 2015 | $1,779 | $163,058 | $45,655 | $117,403 |
| 2014 | $1,779 | $159,864 | $44,761 | $115,103 |
Source: Public Records
Map
Nearby Homes
- 0 E Sequoia Dr
- 800 N Whitney Ave
- 0 N Hayes Ave
- 683 N Villa Ave
- 1237 Chestnut Ln
- 1185 E Ramblewood Dr
- 581 N Crawford Ave Unit 41
- 581 N Crawford Ave Unit 94
- 337 Village Dr
- 277 N H St
- 581 N 581 N Crawford Ave Unit 2
- 1755 W Rosemary Ave Unit Mb65
- 1755 W Rosemary Ave
- 1723 W Rosemary Ave
- 1695 W Rosemary Ave
- 65745 Big Meadows Rd
- 340 N K St
- 201 Bryan Ave
- 1702 Bolinger Way
- 1847 E Lauren Ave
- 821 N Newton Dr
- 875 N Newton Dr
- 812 N Newton Dr
- 793 N Newton Dr
- 893 N Newton Dr
- 798 N Mckinley Ave
- 892 N Newton Dr
- 840 N Newton Dr
- 794 N Newton Dr
- 876 N Newton Dr
- 826 E Saginaw Ave
- 842 N Mckinley Ave
- 822 N Mckinley Ave
- 761 N Newton Dr
- 776 N Newton Dr
- 766 N Mckinley Ave
- 778 N Mckinley Ave
- 821 N Sycamore Dr
- 739 N Newton Dr
- 988 E Saginaw Ave
Your Personal Tour Guide
Ask me questions while you tour the home.