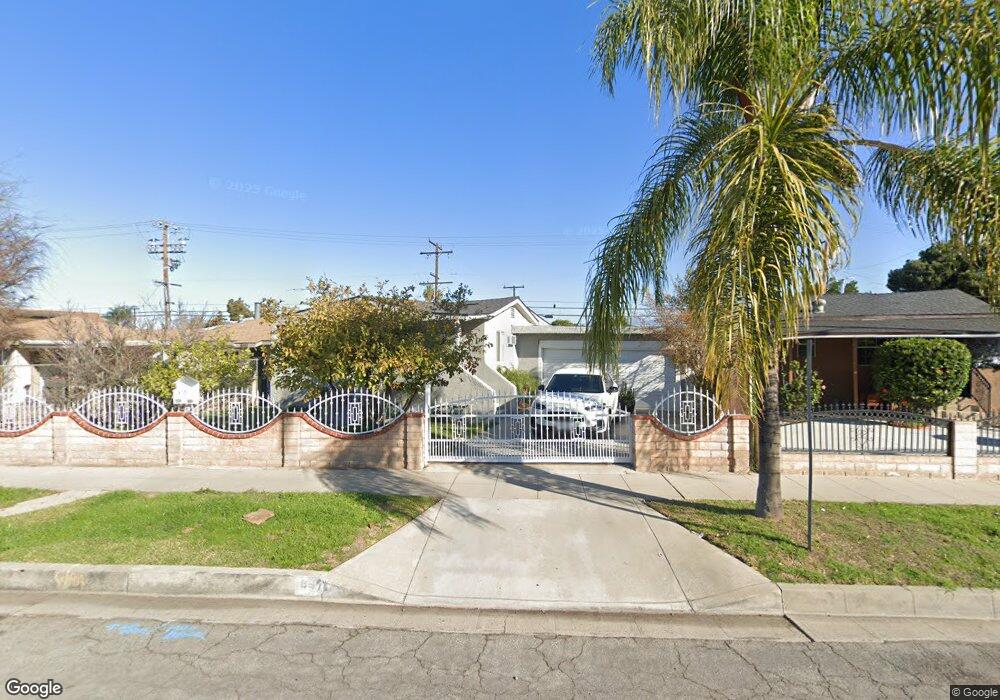
8471 Olympic Blvd Unit B Pico Rivera, CA 90660
Estimated Value: $684,000 - $894,000
4
Beds
2
Baths
1,566
Sq Ft
$504/Sq Ft
Est. Value
About This Home
This home is located at 8471 Olympic Blvd Unit B, Pico Rivera, CA 90660 and is currently estimated at $789,497, approximately $504 per square foot. 8471 Olympic Blvd Unit B is a home located in Los Angeles County with nearby schools including Montebello Gardens Elementary School, La Merced Intermediate School, and Montebello High School.
Ownership History
Date
Name
Owned For
Owner Type
Purchase Details
Closed on
Dec 3, 2015
Sold by
Padilla Concho and Padilla Maria
Bought by
Garcia Juan and Leon Perla Farfan
Current Estimated Value
Home Financials for this Owner
Home Financials are based on the most recent Mortgage that was taken out on this home.
Original Mortgage
$441,849
Outstanding Balance
$351,382
Interest Rate
4.12%
Mortgage Type
FHA
Estimated Equity
$438,115
Purchase Details
Closed on
Mar 26, 1993
Sold by
Padilla Concho and Padilla Jose E
Bought by
Padilla Concho and Padilla Maria
Create a Home Valuation Report for This Property
The Home Valuation Report is an in-depth analysis detailing your home's value as well as a comparison with similar homes in the area
Home Values in the Area
Average Home Value in this Area
Purchase History
| Date | Buyer | Sale Price | Title Company |
|---|---|---|---|
| Garcia Juan | $450,000 | Orange Coast Title Co Socal | |
| Padilla Concho | -- | -- |
Source: Public Records
Mortgage History
| Date | Status | Borrower | Loan Amount |
|---|---|---|---|
| Open | Garcia Juan | $441,849 |
Source: Public Records
Tax History Compared to Growth
Tax History
| Year | Tax Paid | Tax Assessment Tax Assessment Total Assessment is a certain percentage of the fair market value that is determined by local assessors to be the total taxable value of land and additions on the property. | Land | Improvement |
|---|---|---|---|---|
| 2025 | $8,547 | $594,643 | $394,113 | $200,530 |
| 2024 | $8,280 | $582,985 | $386,386 | $196,599 |
| 2023 | $8,261 | $571,555 | $378,810 | $192,745 |
| 2022 | $7,961 | $560,349 | $371,383 | $188,966 |
| 2021 | $6,852 | $492,138 | $300,751 | $191,387 |
| 2020 | $6,790 | $487,093 | $297,668 | $189,425 |
| 2019 | $6,574 | $477,543 | $291,832 | $185,711 |
| 2018 | $6,501 | $468,180 | $286,110 | $182,070 |
| 2016 | $3,866 | $252,081 | $191,756 | $60,325 |
| 2015 | $3,668 | $248,295 | $188,876 | $59,419 |
| 2014 | $3,634 | $243,433 | $185,177 | $58,256 |
Source: Public Records
Map
Nearby Homes
- 4758 Oak St
- 4653 Pine St
- 4753 Orange St
- 4724 Orange St
- 4709 Grape St
- 8630 Elba St
- 4568 Los Toros Ave
- 4707 Rosemead Blvd
- 4424 Calada Ave
- 8421 Culp Dr
- 4918 Rosemead Blvd
- 272 Maiden Ln
- 8509 Beverly Blvd
- 424 Bradley Ave
- 5442 Zola Ave
- 5101 Lindsey Ave
- 425 Valera Dr
- 8803 Dunlap Crossing Rd
- 524 N Poplar Ave
- 9339 Via Azul
- 8471 Olympic Blvd
- 8477 Olympic Blvd
- 8465 Olympic Blvd
- 8461 Olympic Blvd
- 4825 Pine St
- 4828 Oak St
- 4834 Pine St
- 4830 Pine St
- 8457 Olympic Blvd
- 4826 Pine St
- 4820 Oak St
- 4819 Pine St
- 4816 Oak St
- 8513 Olympic Blvd
- 8500 Olympic Blvd
- 4815 Pine St
- 4859 Pine St
- 8464 Olympic Blvd
- 4816 Pine St
- 8462 Olympic Blvd