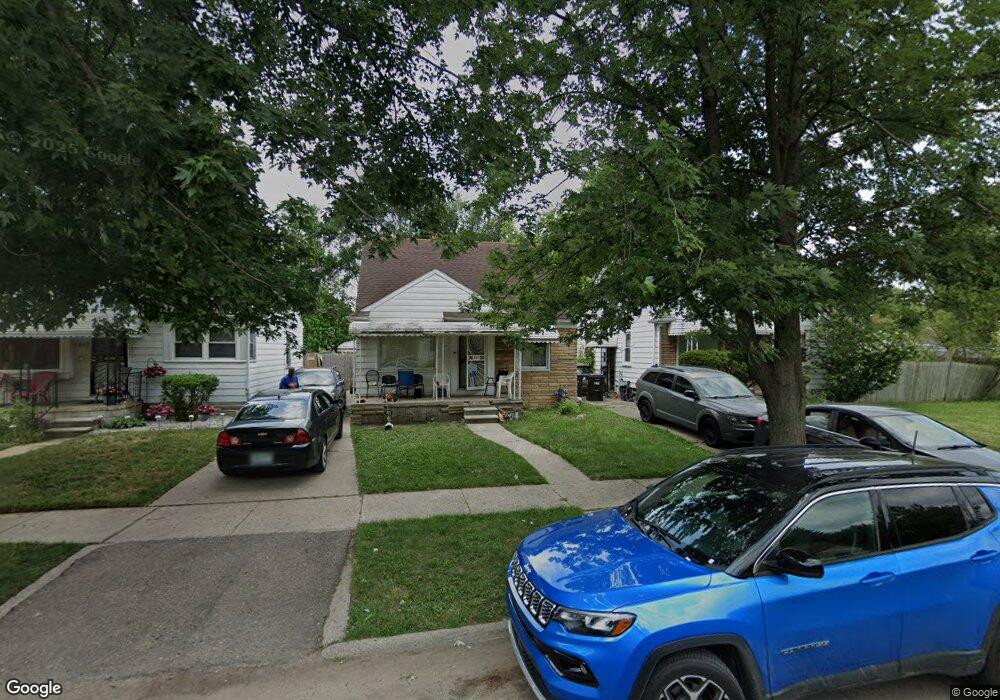
8475 Vaughan St Detroit, MI 48228
Franklin Park NeighborhoodEstimated Value: $71,000 - $94,000
3
Beds
1
Bath
720
Sq Ft
$111/Sq Ft
Est. Value
About This Home
This home is located at 8475 Vaughan St, Detroit, MI 48228 and is currently estimated at $79,870, approximately $110 per square foot. 8475 Vaughan St is a home located in Wayne County with nearby schools including Bates Academy, Charles L. Spain Elementary-Middle School, and Edward 'Duke' Ellington Conservatory of Music and Art.
Ownership History
Date
Name
Owned For
Owner Type
Purchase Details
Closed on
Sep 20, 2021
Sold by
Howard Kenneth
Bought by
Williams Stephanie
Current Estimated Value
Purchase Details
Closed on
Nov 18, 2011
Sold by
Wojtowicz Raymond J
Bought by
Howard Kenneth
Purchase Details
Closed on
Jun 1, 2009
Sold by
Deutsche Bank National Trust Company
Bought by
Realholdings Llc
Purchase Details
Closed on
Nov 21, 2007
Sold by
Foster Bernard
Bought by
Deutsche Bank National Trust Co and Argent Mortgage Securities Inc Asset Bac
Purchase Details
Closed on
Mar 28, 2006
Sold by
Izenwata Chidiebere and Izenwata Latrese Shawntay
Bought by
Foster Bernard
Purchase Details
Closed on
Aug 4, 2004
Sold by
Jenkins Wanda
Bought by
Sun Management
Purchase Details
Closed on
May 23, 2001
Sold by
Hud
Bought by
Jenkins Wanda
Purchase Details
Closed on
May 8, 1998
Sold by
Shrf Wanda L Jenkins Pr
Bought by
Lytle Hud
Create a Home Valuation Report for This Property
The Home Valuation Report is an in-depth analysis detailing your home's value as well as a comparison with similar homes in the area
Home Values in the Area
Average Home Value in this Area
Purchase History
| Date | Buyer | Sale Price | Title Company |
|---|---|---|---|
| Williams Stephanie | $20,000 | None Available | |
| Howard Kenneth | $1,850 | None Available | |
| Realholdings Llc | $1,829 | None Available | |
| Deutsche Bank National Trust Co | $97,127 | None Available | |
| Foster Bernard | $105,000 | None Available | |
| Sun Management | $49,813 | -- | |
| Jenkins Wanda | -- | -- | |
| Lytle Hud | $33,795 | -- |
Source: Public Records
Tax History Compared to Growth
Tax History
| Year | Tax Paid | Tax Assessment Tax Assessment Total Assessment is a certain percentage of the fair market value that is determined by local assessors to be the total taxable value of land and additions on the property. | Land | Improvement |
|---|---|---|---|---|
| 2025 | $1,268 | $30,900 | $0 | $0 |
| 2024 | $1,268 | $26,000 | $0 | $0 |
| 2023 | $1,351 | $20,300 | $0 | $0 |
| 2022 | $2,665 | $17,700 | $0 | $0 |
| 2021 | $1,040 | $14,000 | $0 | $0 |
| 2020 | $1,003 | $12,500 | $0 | $0 |
| 2019 | $989 | $10,900 | $0 | $0 |
| 2018 | $1,041 | $10,400 | $0 | $0 |
| 2017 | $201 | $10,600 | $0 | $0 |
| 2016 | $1,219 | $11,600 | $0 | $0 |
| 2015 | $1,160 | $11,600 | $0 | $0 |
| 2013 | $1,735 | $17,352 | $0 | $0 |
| 2010 | -- | $25,441 | $802 | $24,639 |
Source: Public Records
Map
Nearby Homes
- 8491 Heyden St
- 8600 Heyden St
- 8468 Vaughan St
- 8638 Heyden St
- 8627 Stout St
- 8418 Fielding St
- 8620 Fielding St
- 8695 Evergreen Ave
- 8682 Fielding St
- 8656 Plainview Ave
- 8832 Vaughan St
- 8294 Plainview Ave
- 8848 Heyden St
- 8282 Plainview Ave
- 8855 Stout St
- 8610 Auburn St
- 8084 Evergreen Rd
- 8103 Fielding St
- 8878 Evergreen Ave
- 8889 Plainview Ave
- 8478 Heyden St
- 8486 Heyden St
- 8465 Vaughan St
- 8481 Vaughan St
- 8461 Vaughan St
- 8487 Vaughan St
- 8494 Heyden St
- 8460 Heyden St
- 8470 Heyden St
- 8453 Vaughan St
- 8452 Heyden St
- 8500 Heyden St
- 8500 Heyden St
- 8447 Vaughan St
- 8501 Vaughan St
- 8508 Heyden St
- 8441 Vaughan St
- 8444 Heyden St
- 8509 Vaughan St
- 8436 Heyden St