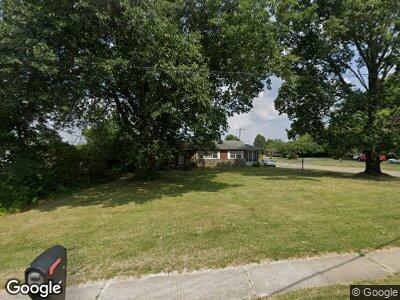
8478 Cheviot Rd Cincinnati, OH 45247
Estimated Value: $224,000 - $266,947
3
Beds
2
Baths
1,992
Sq Ft
$121/Sq Ft
Est. Value
About This Home
This home is located at 8478 Cheviot Rd, Cincinnati, OH 45247 and is currently estimated at $241,237, approximately $121 per square foot. 8478 Cheviot Rd is a home located in Hamilton County with nearby schools including White Oak Middle School, Colerain High School, and Our Lady of Grace Catholic School.
Ownership History
Date
Name
Owned For
Owner Type
Purchase Details
Closed on
Jun 30, 2022
Sold by
Renck Enterprises Llc
Bought by
Luedeke Angela
Current Estimated Value
Home Financials for this Owner
Home Financials are based on the most recent Mortgage that was taken out on this home.
Original Mortgage
$180,000
Outstanding Balance
$173,369
Interest Rate
5.81%
Mortgage Type
Seller Take Back
Estimated Equity
$67,868
Purchase Details
Closed on
Mar 26, 2009
Sold by
Deutsche Bank National Trust Company
Bought by
Renck Enterprises Llc
Purchase Details
Closed on
Nov 17, 2008
Sold by
Davis Jerry and Davis Shawna
Bought by
Deutsche Bank National Trust Company
Purchase Details
Closed on
Jul 26, 2002
Sold by
Dinkins Larry W and Dinkins Jacqueline L
Bought by
Davis Jerry and Davis Shawna
Home Financials for this Owner
Home Financials are based on the most recent Mortgage that was taken out on this home.
Original Mortgage
$113,815
Interest Rate
9.5%
Create a Home Valuation Report for This Property
The Home Valuation Report is an in-depth analysis detailing your home's value as well as a comparison with similar homes in the area
Home Values in the Area
Average Home Value in this Area
Purchase History
| Date | Buyer | Sale Price | Title Company |
|---|---|---|---|
| Luedeke Angela | $180,000 | -- | |
| Renck Enterprises Llc | $65,500 | Federated Land Title Agency | |
| Deutsche Bank National Trust Company | $97,000 | Attorney | |
| Davis Jerry | $133,900 | Park Place Title Agency |
Source: Public Records
Mortgage History
| Date | Status | Borrower | Loan Amount |
|---|---|---|---|
| Open | Luedeke Angela | $180,000 | |
| Previous Owner | Davis Jerry | $113,815 | |
| Previous Owner | Dinkins Larry W | $92,000 | |
| Closed | Davis Jerry | $13,390 |
Source: Public Records
Tax History Compared to Growth
Tax History
| Year | Tax Paid | Tax Assessment Tax Assessment Total Assessment is a certain percentage of the fair market value that is determined by local assessors to be the total taxable value of land and additions on the property. | Land | Improvement |
|---|---|---|---|---|
| 2024 | $3,375 | $63,000 | $19,320 | $43,680 |
| 2023 | $3,396 | $63,000 | $19,320 | $43,680 |
| 2022 | $3,192 | $46,855 | $19,093 | $27,762 |
| 2021 | $3,222 | $46,855 | $19,093 | $27,762 |
| 2020 | $3,184 | $46,855 | $19,093 | $27,762 |
| 2019 | $2,769 | $37,787 | $15,397 | $22,390 |
| 2018 | $2,492 | $37,787 | $15,397 | $22,390 |
| 2017 | $2,395 | $37,787 | $15,397 | $22,390 |
| 2016 | $2,634 | $40,618 | $16,303 | $24,315 |
| 2015 | $2,623 | $40,618 | $16,303 | $24,315 |
| 2014 | $2,630 | $40,618 | $16,303 | $24,315 |
| 2013 | $2,507 | $40,618 | $16,303 | $24,315 |
Source: Public Records
Map
Nearby Homes
- 8474 Chesswood Dr
- 3693 W Galbraith Rd
- 7913 Cheviot Rd
- 3701 W Galbraith Rd
- 3801 Woodthrush Dr
- 7914 Cheviot Rd
- 3414 Dolomar Dr
- 3369 W Galbraith Rd
- 3950 Olde Savannah Dr
- 8692 Wuest Rd
- 8714 Wuest Rd
- 9257 Erin Dr
- 3282 Dolomar Dr
- 7620 Cheviot Rd
- 3388 Alexis Rd
- 4130 Poole Rd
- 3333 Alexis Rd
- 7516 Cella Dr
- 3329 Alexis Rd
- 3633 Woodsong Dr
- 8478 Cheviot Rd
- 8492 Cheviot Rd
- 8492 Cheviot Rd
- 8500 Cheviot Rd
- 8456 Cheviot Rd
- 3548 Oakmeadow Ln
- 3561 Oakmeadow Ln
- 8481 Cheviot Rd
- 3549 Oakmeadow Ln
- 3536 Oakmeadow Ln
- 8493 Cheviot Rd
- 3522 Howdy Ct
- 3537 Oakmeadow Ln
- 8457 Cheviot Rd
- 3524 Oakmeadow Ln
- 8507 Cheviot Rd
- 3612 Oakmeadow Ln
- 8445 Cheviot Rd
- 3525 Oakmeadow Ln
- 8519 Cheviot Rd