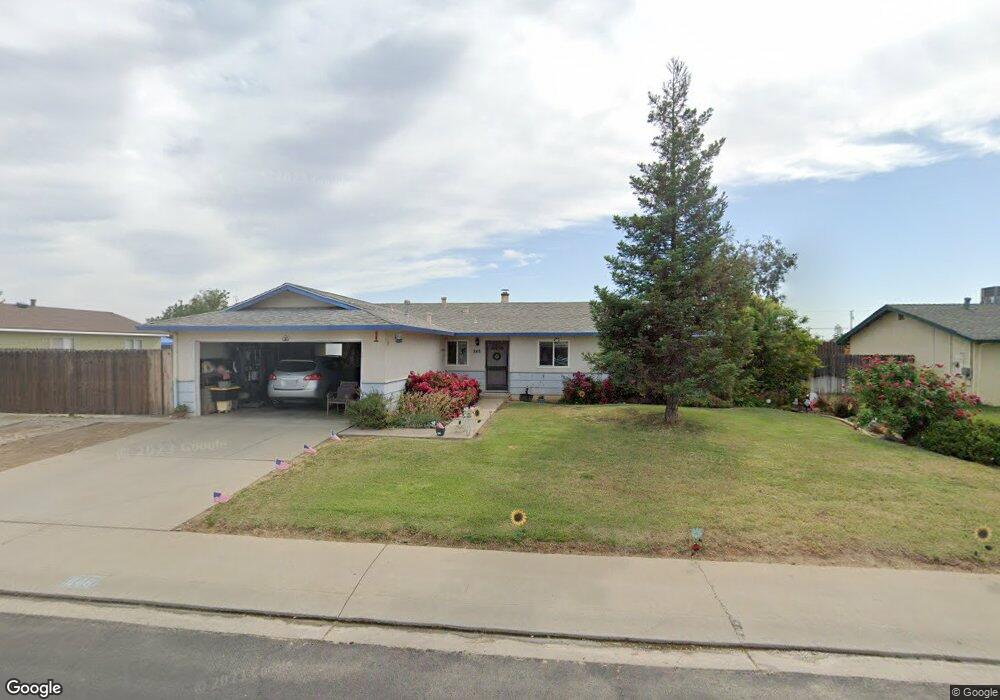
848 Lorenzo St Hickman, CA 95323
Estimated Value: $258,000 - $325,588
3
Beds
2
Baths
1,152
Sq Ft
$261/Sq Ft
Est. Value
About This Home
This home is located at 848 Lorenzo St, Hickman, CA 95323 and is currently estimated at $301,147, approximately $261 per square foot. 848 Lorenzo St is a home located in Stanislaus County with nearby schools including Hickman Elementary School, Connecting Waters Charter School, and Hickman Middle School.
Ownership History
Date
Name
Owned For
Owner Type
Purchase Details
Closed on
Jun 28, 2012
Sold by
Chamberlain Robert Nicholas
Bought by
Chamberlain Family Trust
Current Estimated Value
Purchase Details
Closed on
Aug 14, 2001
Sold by
Brooks Michael C and Brooks Jackie K
Bought by
Chamberlain Robert N
Home Financials for this Owner
Home Financials are based on the most recent Mortgage that was taken out on this home.
Original Mortgage
$85,000
Outstanding Balance
$32,917
Interest Rate
7.05%
Estimated Equity
$268,230
Create a Home Valuation Report for This Property
The Home Valuation Report is an in-depth analysis detailing your home's value as well as a comparison with similar homes in the area
Home Values in the Area
Average Home Value in this Area
Purchase History
| Date | Buyer | Sale Price | Title Company |
|---|---|---|---|
| Chamberlain Family Trust | -- | None Available | |
| Chamberlain Family Trust | -- | None Available | |
| Chamberlain Robert N | $100,000 | Fidelity National Title Co |
Source: Public Records
Mortgage History
| Date | Status | Borrower | Loan Amount |
|---|---|---|---|
| Open | Chamberlain Robert N | $85,000 |
Source: Public Records
Tax History Compared to Growth
Tax History
| Year | Tax Paid | Tax Assessment Tax Assessment Total Assessment is a certain percentage of the fair market value that is determined by local assessors to be the total taxable value of land and additions on the property. | Land | Improvement |
|---|---|---|---|---|
| 2025 | $1,806 | $147,705 | $51,692 | $96,013 |
| 2024 | $1,815 | $144,810 | $50,679 | $94,131 |
| 2023 | $1,769 | $141,972 | $49,686 | $92,286 |
| 2022 | $1,735 | $139,189 | $48,712 | $90,477 |
| 2021 | $1,698 | $136,460 | $47,757 | $88,703 |
| 2020 | $1,668 | $135,062 | $47,268 | $87,794 |
| 2019 | $1,642 | $132,415 | $46,342 | $86,073 |
| 2018 | $1,600 | $129,820 | $45,434 | $84,386 |
| 2017 | $1,645 | $127,276 | $44,544 | $82,732 |
| 2016 | $1,580 | $124,781 | $43,671 | $81,110 |
| 2015 | $1,557 | $122,908 | $43,016 | $79,892 |
| 2014 | $1,544 | $120,502 | $42,174 | $78,328 |
Source: Public Records
Map
Nearby Homes