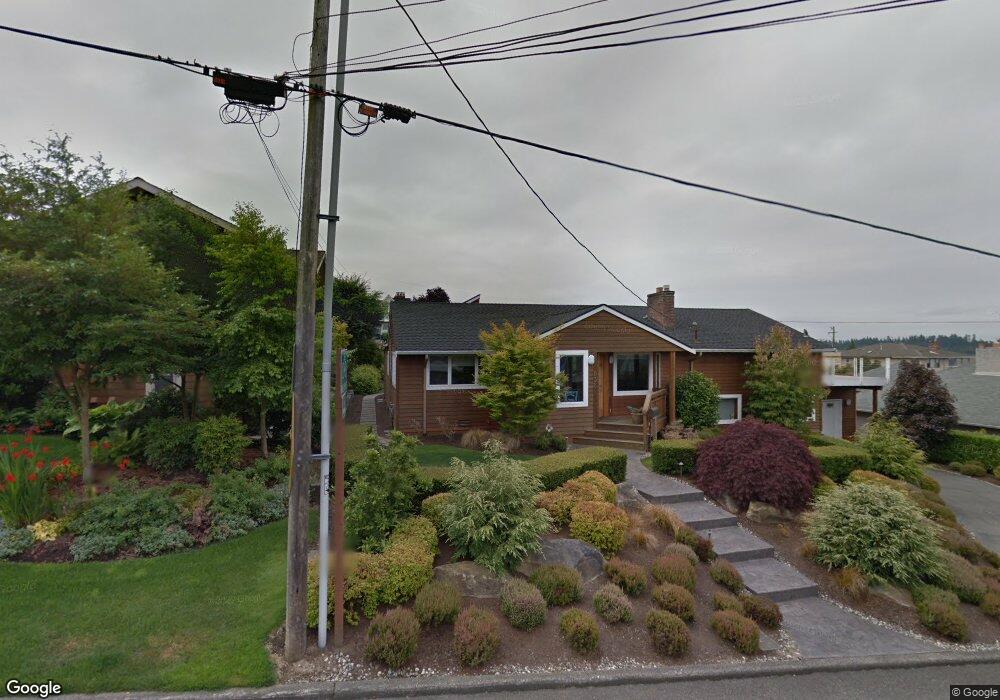
848 Maple St Edmonds, WA 98020
Downtown Edmonds NeighborhoodEstimated Value: $1,506,000 - $1,828,000
3
Beds
3
Baths
2,177
Sq Ft
$764/Sq Ft
Est. Value
About This Home
This home is located at 848 Maple St, Edmonds, WA 98020 and is currently estimated at $1,663,706, approximately $764 per square foot. 848 Maple St is a home located in Snohomish County with nearby schools including Sherwood Elementary School, College Place Middle School, and Edmonds-Woodway High School.
Ownership History
Date
Name
Owned For
Owner Type
Purchase Details
Closed on
Oct 20, 2004
Sold by
Silver Kristi L
Bought by
Bender James C and Silver Kristi L
Current Estimated Value
Home Financials for this Owner
Home Financials are based on the most recent Mortgage that was taken out on this home.
Original Mortgage
$250,000
Interest Rate
5.12%
Mortgage Type
Purchase Money Mortgage
Purchase Details
Closed on
Nov 19, 1997
Sold by
Silver Kristi L and Landresse Phillip
Bought by
Silver Kristi L
Create a Home Valuation Report for This Property
The Home Valuation Report is an in-depth analysis detailing your home's value as well as a comparison with similar homes in the area
Home Values in the Area
Average Home Value in this Area
Purchase History
| Date | Buyer | Sale Price | Title Company |
|---|---|---|---|
| Bender James C | $11,235 | Pnwt | |
| Silver Kristi L | -- | -- |
Source: Public Records
Mortgage History
| Date | Status | Borrower | Loan Amount |
|---|---|---|---|
| Closed | Bender James C | $250,000 |
Source: Public Records
Tax History
| Year | Tax Paid | Tax Assessment Tax Assessment Total Assessment is a certain percentage of the fair market value that is determined by local assessors to be the total taxable value of land and additions on the property. | Land | Improvement |
|---|---|---|---|---|
| 2025 | $11,557 | $1,767,200 | $1,199,500 | $567,700 |
| 2024 | $11,557 | $1,624,300 | $1,077,800 | $546,500 |
| 2023 | $10,639 | $1,549,500 | $1,011,000 | $538,500 |
| 2022 | $9,989 | $1,196,100 | $741,800 | $454,300 |
| 2020 | $9,745 | $1,043,600 | $651,100 | $392,500 |
| 2019 | $9,397 | $1,013,600 | $633,800 | $379,800 |
| 2018 | $9,403 | $876,300 | $535,900 | $340,400 |
| 2017 | $8,229 | $802,400 | $483,000 | $319,400 |
| 2016 | $7,521 | $726,600 | $420,000 | $306,600 |
Source: Public Records
Map
Nearby Homes
- 217 9th Ave S
- 926 Dayton St
- 816 Walnut St
- 1021 Walnut St
- 624 Alder St
- 640 Bell St
- 9533 Bowdoin Way
- 550 Dayton St Unit 201
- 546 Walnut St Unit 201
- 902 7th Ave S
- 647 9th Ave N
- 505 5th Ave S Unit 205
- 621 Daley St
- 603 7th Ave N Unit A306
- 609 7th Ave N Unit B304
- 616 Glen St Unit 202
- 1108 9th Ave S
- 614 5th Ave S Unit C101
- 614 5th Ave S Unit C107
- 1128 Sea Vista Place
Your Personal Tour Guide
Ask me questions while you tour the home.