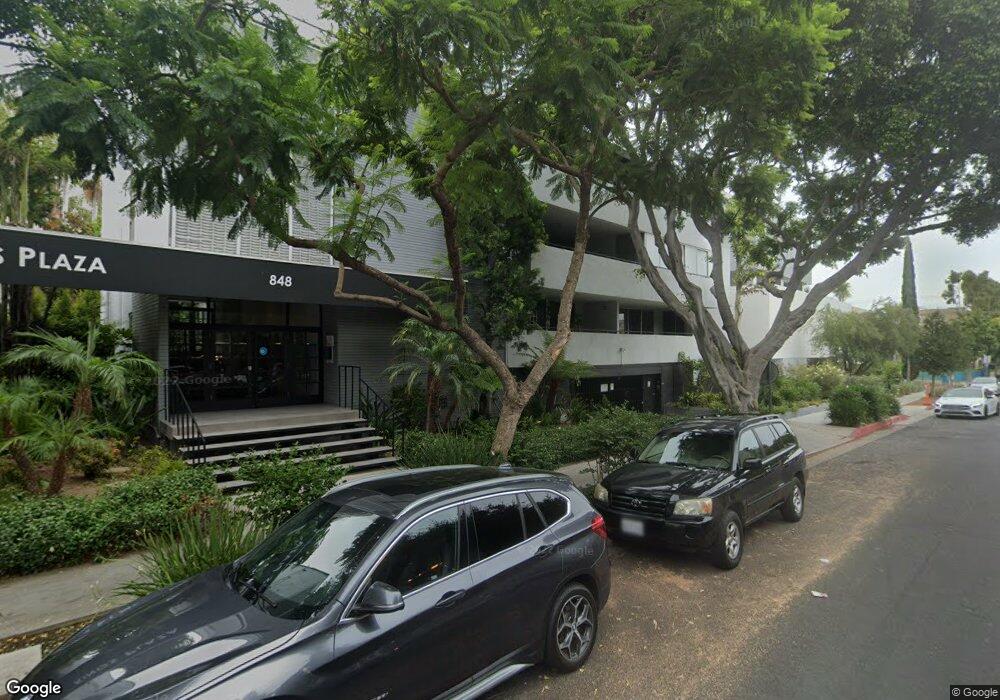
848 N Kings Rd Unit 105 West Hollywood, CA 90069
Estimated Value: $854,000 - $1,062,000
2
Beds
2
Baths
1,317
Sq Ft
$697/Sq Ft
Est. Value
About This Home
This home is located at 848 N Kings Rd Unit 105, West Hollywood, CA 90069 and is currently estimated at $918,348, approximately $697 per square foot. 848 N Kings Rd Unit 105 is a home located in Los Angeles County with nearby schools including Rosewood Avenue Elementary School, Hubert Howe Bancroft Middle School, and Fairfax High School.
Ownership History
Date
Name
Owned For
Owner Type
Purchase Details
Closed on
Aug 10, 2004
Sold by
Davis R Bradley
Bought by
Ayoub Richard
Current Estimated Value
Home Financials for this Owner
Home Financials are based on the most recent Mortgage that was taken out on this home.
Original Mortgage
$350,000
Outstanding Balance
$157,477
Interest Rate
4.62%
Mortgage Type
Purchase Money Mortgage
Estimated Equity
$760,871
Purchase Details
Closed on
Oct 7, 1996
Sold by
The First National Bank Of Chicago
Bought by
Davis R Bradley
Home Financials for this Owner
Home Financials are based on the most recent Mortgage that was taken out on this home.
Original Mortgage
$139,500
Interest Rate
8.37%
Purchase Details
Closed on
Apr 26, 1996
Sold by
Genis Martin W and Genis Alison C
Bought by
The First National Bank Of Chicago and Rtc Mtg Pass Through Certificates Series
Create a Home Valuation Report for This Property
The Home Valuation Report is an in-depth analysis detailing your home's value as well as a comparison with similar homes in the area
Home Values in the Area
Average Home Value in this Area
Purchase History
| Date | Buyer | Sale Price | Title Company |
|---|---|---|---|
| Ayoub Richard | $535,000 | Equity Title Company | |
| Davis R Bradley | $147,000 | Guardian Title | |
| The First National Bank Of Chicago | $127,256 | First Southwestern Title |
Source: Public Records
Mortgage History
| Date | Status | Borrower | Loan Amount |
|---|---|---|---|
| Open | Ayoub Richard | $350,000 | |
| Previous Owner | Davis R Bradley | $139,500 | |
| Closed | Ayoub Richard | $158,200 |
Source: Public Records
Tax History Compared to Growth
Tax History
| Year | Tax Paid | Tax Assessment Tax Assessment Total Assessment is a certain percentage of the fair market value that is determined by local assessors to be the total taxable value of land and additions on the property. | Land | Improvement |
|---|---|---|---|---|
| 2025 | $8,993 | $745,724 | $596,588 | $149,136 |
| 2024 | $8,993 | $731,103 | $584,891 | $146,212 |
| 2023 | $8,840 | $716,769 | $573,423 | $143,346 |
| 2022 | $8,395 | $702,716 | $562,180 | $140,536 |
| 2021 | $8,333 | $688,938 | $551,157 | $137,781 |
| 2019 | $8,058 | $668,506 | $534,810 | $133,696 |
| 2018 | $8,001 | $655,399 | $524,324 | $131,075 |
| 2016 | $7,660 | $629,951 | $503,965 | $125,986 |
| 2015 | $7,538 | $620,489 | $496,395 | $124,094 |
| 2014 | $7,535 | $608,336 | $486,672 | $121,664 |
Source: Public Records
Map
Nearby Homes
- 825 N Kings Rd Unit 1
- 851 N Kings Rd Unit 102
- 851 N Kings Rd Unit 207
- 851 N Kings Rd Unit 301
- 810 N Orlando Ave
- 850 N Kings Rd Unit 312
- 911 N Kings Rd Unit 319
- 840 N Croft Ave Unit 301
- 750 N Kings Rd Unit 118
- 750 N Kings Rd Unit 105
- 750 N Kings Rd Unit 201
- 810 N Sweetzer Ave
- 927 N Kings Rd Unit 212
- 927 N Kings Rd Unit 107
- 927 N Kings Rd Unit 113
- 812 N Sweetzer Ave
- 806 N Sweetzer Ave
- 950 N Kings Rd Unit 245
- 950 N Kings Rd Unit 233
- 950 N Kings Rd Unit 315
- 848 N Kings Rd
- 848 N Kings Rd
- 848 N Kings Rd Unit 111
- 848 N Kings Rd Unit 202
- 848 N Kings Rd Unit PH1
- 848 N Kings Rd Unit PH2
- 848 N Kings Rd Unit 101
- 848 N Kings Rd Unit 312
- 848 N Kings Rd Unit 310
- 848 N Kings Rd Unit 308
- 848 N Kings Rd Unit 109
- 848 N Kings Rd Unit 107
- 848 N Kings Rd Unit 106
- 848 N Kings Rd Unit 104
- 848 N Kings Rd Unit 102
- 848 N Kings Rd Unit 103
- 848 N Kings Rd Unit 311
- 848 N Kings Rd Unit 309
- 848 N Kings Rd Unit 307
- 848 N Kings Rd Unit 306