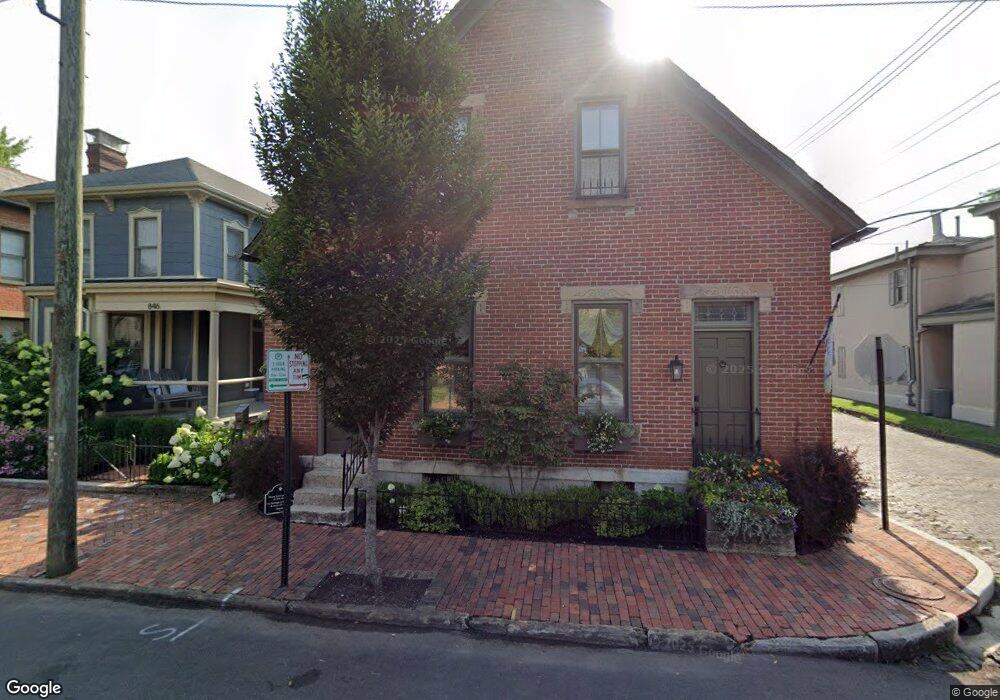
848 S 5th St Columbus, OH 43206
German Village NeighborhoodEstimated Value: $545,782 - $844,000
2
Beds
2
Baths
1,619
Sq Ft
$408/Sq Ft
Est. Value
About This Home
This home is located at 848 S 5th St, Columbus, OH 43206 and is currently estimated at $660,446, approximately $407 per square foot. 848 S 5th St is a home located in Franklin County with nearby schools including Siebert Elementary School, South High School, and South Columbus Preparatory Academy.
Ownership History
Date
Name
Owned For
Owner Type
Purchase Details
Closed on
Mar 16, 2017
Sold by
Sherman Sallie J
Bought by
Sallie J Sherman Revocable Trust
Current Estimated Value
Purchase Details
Closed on
May 29, 2001
Sold by
Alfred Douglas E
Bought by
Sherman Sallie J
Home Financials for this Owner
Home Financials are based on the most recent Mortgage that was taken out on this home.
Original Mortgage
$251,250
Outstanding Balance
$96,335
Interest Rate
7.23%
Estimated Equity
$564,111
Purchase Details
Closed on
Aug 8, 1996
Sold by
Meek Cardine R
Bought by
Douglas E Alfred
Home Financials for this Owner
Home Financials are based on the most recent Mortgage that was taken out on this home.
Original Mortgage
$115,000
Interest Rate
8.33%
Mortgage Type
Balloon
Create a Home Valuation Report for This Property
The Home Valuation Report is an in-depth analysis detailing your home's value as well as a comparison with similar homes in the area
Home Values in the Area
Average Home Value in this Area
Purchase History
| Date | Buyer | Sale Price | Title Company |
|---|---|---|---|
| Sallie J Sherman Revocable Trust | -- | None Available | |
| Sherman Sallie J | $335,000 | Amerititle Agency Inc | |
| Douglas E Alfred | $145,000 | -- |
Source: Public Records
Mortgage History
| Date | Status | Borrower | Loan Amount |
|---|---|---|---|
| Open | Sherman Sallie J | $251,250 | |
| Previous Owner | Douglas E Alfred | $115,000 |
Source: Public Records
Tax History Compared to Growth
Tax History
| Year | Tax Paid | Tax Assessment Tax Assessment Total Assessment is a certain percentage of the fair market value that is determined by local assessors to be the total taxable value of land and additions on the property. | Land | Improvement |
|---|---|---|---|---|
| 2024 | $7,455 | $166,120 | $91,740 | $74,380 |
| 2023 | $7,360 | $166,120 | $91,740 | $74,380 |
| 2022 | $6,620 | $127,650 | $34,930 | $92,720 |
| 2021 | $6,632 | $127,650 | $34,930 | $92,720 |
| 2020 | $6,641 | $127,650 | $34,930 | $92,720 |
| 2019 | $6,780 | $111,760 | $30,380 | $81,380 |
| 2018 | $7,383 | $111,760 | $30,380 | $81,380 |
| 2017 | $7,794 | $111,760 | $30,380 | $81,380 |
| 2016 | $8,813 | $133,040 | $25,310 | $107,730 |
| 2015 | $8,000 | $133,040 | $25,310 | $107,730 |
| 2014 | $8,020 | $133,040 | $25,310 | $107,730 |
| 2013 | $3,767 | $126,700 | $24,115 | $102,585 |
Source: Public Records
Map
Nearby Homes
- 243 E Whittier St Unit 245
- 273 Reinhard Ave
- 136 E Whittier St
- 320 E Columbus St
- 783 Mohawk St
- 745 Mohawk St
- 718 S 6th St
- 781 Bruck St
- 432 E Kossuth St
- 688 S 5th St
- 307 E Sycamore St
- 707 Sycamore Place Unit 707
- 842 S Pearl St
- 278 E Sycamore St
- 418 Forest St
- 717 S 3rd St
- 37 Stewart Ave
- 874 S High St
- 472 E Whittier St
- 1023 City Park Ave