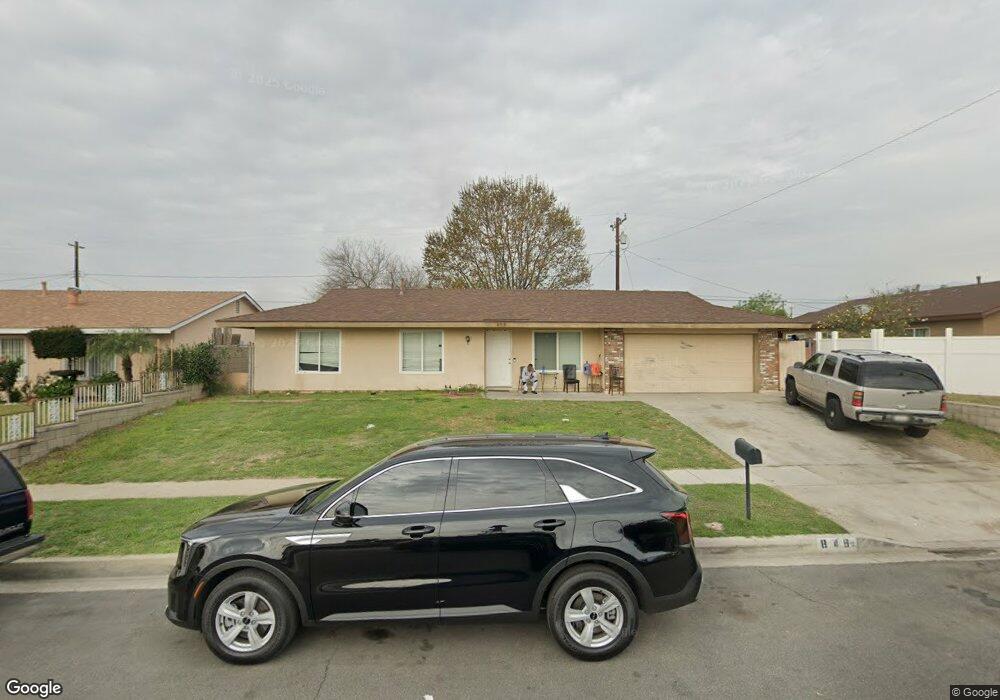
848 S Ironwood Ave Bloomington, CA 92316
Estimated Value: $483,626 - $540,000
3
Beds
2
Baths
1,060
Sq Ft
$490/Sq Ft
Est. Value
About This Home
This home is located at 848 S Ironwood Ave, Bloomington, CA 92316 and is currently estimated at $519,657, approximately $490 per square foot. 848 S Ironwood Ave is a home located in San Bernardino County with nearby schools including Maple Elementary School, Alder Middle School, and Jurupa Hills High School.
Ownership History
Date
Name
Owned For
Owner Type
Purchase Details
Closed on
Apr 28, 2017
Sold by
2013-1 Ih Borrower Lp
Bought by
2017-1 Ih Borrower Lp
Current Estimated Value
Purchase Details
Closed on
Aug 8, 2012
Sold by
Maxim Charles and Maxim Dolly
Bought by
Thr California Llc
Purchase Details
Closed on
Apr 13, 2005
Sold by
Rice Paul G
Bought by
Maxim Charles and Maxim Dolly
Home Financials for this Owner
Home Financials are based on the most recent Mortgage that was taken out on this home.
Original Mortgage
$215,600
Interest Rate
5.25%
Mortgage Type
Fannie Mae Freddie Mac
Purchase Details
Closed on
Mar 29, 1996
Sold by
Rice Roberta
Bought by
Rice Paul G
Home Financials for this Owner
Home Financials are based on the most recent Mortgage that was taken out on this home.
Original Mortgage
$47,401
Interest Rate
6.98%
Mortgage Type
FHA
Create a Home Valuation Report for This Property
The Home Valuation Report is an in-depth analysis detailing your home's value as well as a comparison with similar homes in the area
Home Values in the Area
Average Home Value in this Area
Purchase History
| Date | Buyer | Sale Price | Title Company |
|---|---|---|---|
| 2017-1 Ih Borrower Lp | -- | None Available | |
| Thr California Llc | $137,700 | Chicago Title Company | |
| Maxim Charles | $269,500 | Stewart Title Company | |
| Rice Paul G | -- | Old Republic Title Company |
Source: Public Records
Mortgage History
| Date | Status | Borrower | Loan Amount |
|---|---|---|---|
| Previous Owner | Maxim Charles | $215,600 | |
| Previous Owner | Rice Paul G | $47,401 |
Source: Public Records
Tax History
| Year | Tax Paid | Tax Assessment Tax Assessment Total Assessment is a certain percentage of the fair market value that is determined by local assessors to be the total taxable value of land and additions on the property. | Land | Improvement |
|---|---|---|---|---|
| 2025 | $3,893 | $307,555 | $104,453 | $203,102 |
| 2024 | $3,630 | $301,525 | $102,405 | $199,120 |
| 2023 | $3,547 | $295,613 | $100,397 | $195,216 |
| 2022 | $3,498 | $289,816 | $98,428 | $191,388 |
| 2021 | $3,459 | $284,133 | $96,498 | $187,635 |
| 2020 | $3,441 | $281,220 | $95,509 | $185,711 |
| 2019 | $3,348 | $275,706 | $93,636 | $182,070 |
| 2018 | $3,372 | $270,300 | $91,800 | $178,500 |
| 2017 | $2,012 | $145,363 | $47,746 | $97,617 |
| 2016 | $1,645 | $142,513 | $46,810 | $95,703 |
| 2015 | $1,882 | $163,197 | $56,099 | $107,098 |
| 2014 | $1,884 | $160,000 | $55,000 | $105,000 |
Source: Public Records
Map
Nearby Homes
- 868 S Ironwood Ave
- 1459 W James St
- 839 S Aspen Ave
- 18605 Sequoia Ave
- 9050 Dumond Dr
- 9416 Cedar Ave
- 1510 W Merrill Ave
- 504 S Quince Ave
- 9454 Frankfort Ave
- 9431 Laurel Ave
- 18316 W Hawthorne St
- 9824 Linden Ave
- 9543 Laurel Ave
- 18793 San Bernardino Ave
- 18087 San Bernardino Ave
- 8787 Locust Ave Unit 24
- 8787 Locust Ave Unit 69
- 8787 Locust Ave Unit 1
- 18239 Orange Way
- 18325 El Molino St
- 858 S Ironwood Ave
- 1553 Pinedale Ave
- 847 S Sandalwood Ave
- 857 S Sandalwood Ave
- 1565 Pinedale Ave
- 847 S Ironwood Ave
- 867 S Sandalwood Ave
- 857 S Ironwood Ave
- 1527 Pinedale Ave
- 1554 Pinedale Ave
- 878 S Ironwood Ave
- 867 S Ironwood Ave
- 1566 Pinedale Ave
- 877 S Sandalwood Ave
- 848 S Sandalwood Ave
- 848 S Linden Ave
- 1528 Pinedale Ave
- 877 S Ironwood Ave
- 858 S Sandalwood Ave
- 858 S Linden Ave
Your Personal Tour Guide
Ask me questions while you tour the home.