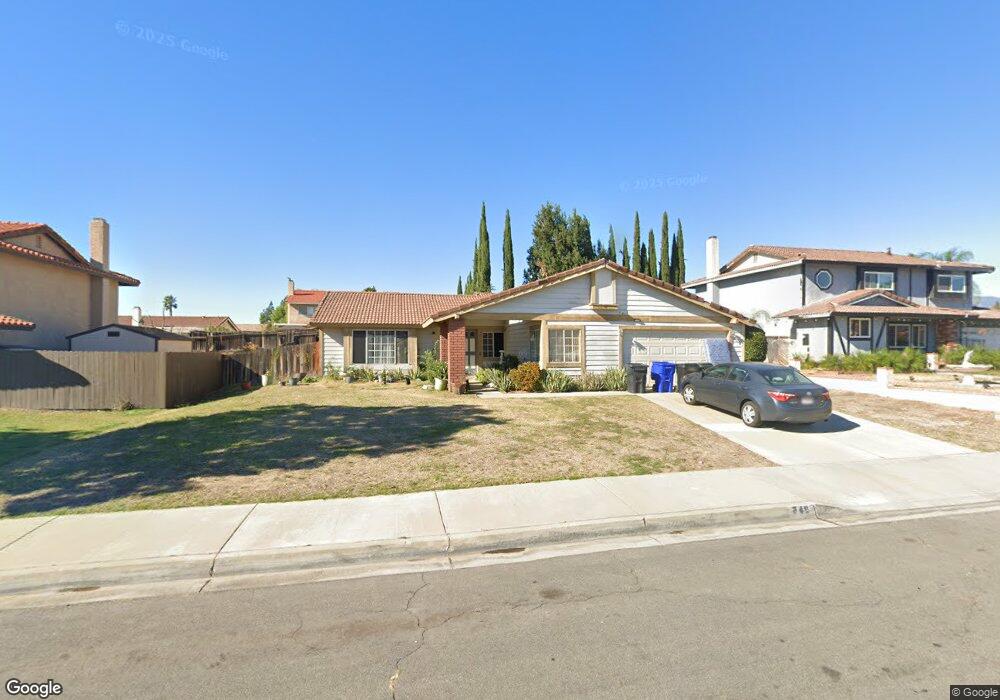
848 S Vine Ave Rialto, CA 92376
Estimated Value: $579,617 - $639,000
4
Beds
2
Baths
1,732
Sq Ft
$355/Sq Ft
Est. Value
About This Home
This home is located at 848 S Vine Ave, Rialto, CA 92376 and is currently estimated at $614,404, approximately $354 per square foot. 848 S Vine Ave is a home located in San Bernardino County with nearby schools including Maple Elementary School, Alder Middle School, and Jurupa Hills High School.
Ownership History
Date
Name
Owned For
Owner Type
Purchase Details
Closed on
Nov 18, 2022
Sold by
Chang Chia-Yie Victor and Chang Pei-Pei
Bought by
Chang Family Revocable Trust
Current Estimated Value
Purchase Details
Closed on
Dec 28, 2010
Sold by
Fannie Mae
Bought by
Chang Chia Yie Victor and Chang Pei
Purchase Details
Closed on
Mar 19, 2010
Sold by
Hamilton Brett C
Bought by
Federal National Mortgage Association
Purchase Details
Closed on
May 30, 2006
Sold by
Hamilton Stephen H
Bought by
Hamilton Brett C
Home Financials for this Owner
Home Financials are based on the most recent Mortgage that was taken out on this home.
Original Mortgage
$360,050
Interest Rate
3.25%
Mortgage Type
Purchase Money Mortgage
Create a Home Valuation Report for This Property
The Home Valuation Report is an in-depth analysis detailing your home's value as well as a comparison with similar homes in the area
Home Values in the Area
Average Home Value in this Area
Purchase History
| Date | Buyer | Sale Price | Title Company |
|---|---|---|---|
| Chang Family Revocable Trust | -- | -- | |
| Chang Chia Yie Victor | $140,000 | Old Republic Title Company | |
| Federal National Mortgage Association | $368,166 | Landsafe Title | |
| Hamilton Brett C | $378,000 | Alliance Title Company |
Source: Public Records
Mortgage History
| Date | Status | Borrower | Loan Amount |
|---|---|---|---|
| Previous Owner | Hamilton Brett C | $360,050 |
Source: Public Records
Tax History Compared to Growth
Tax History
| Year | Tax Paid | Tax Assessment Tax Assessment Total Assessment is a certain percentage of the fair market value that is determined by local assessors to be the total taxable value of land and additions on the property. | Land | Improvement |
|---|---|---|---|---|
| 2025 | $2,624 | $179,366 | $51,247 | $128,119 |
| 2024 | $2,624 | $175,849 | $50,242 | $125,607 |
| 2023 | $2,593 | $172,401 | $49,257 | $123,144 |
| 2022 | $2,555 | $169,020 | $48,291 | $120,729 |
| 2021 | $2,529 | $165,706 | $47,344 | $118,362 |
| 2020 | $2,532 | $164,007 | $46,859 | $117,148 |
| 2019 | $2,471 | $160,791 | $45,940 | $114,851 |
| 2018 | $2,484 | $157,638 | $45,039 | $112,599 |
| 2017 | $2,468 | $154,547 | $44,156 | $110,391 |
| 2016 | $2,038 | $151,516 | $43,290 | $108,226 |
| 2015 | $2,012 | $149,240 | $42,640 | $106,600 |
| 2014 | $2,009 | $146,317 | $41,805 | $104,512 |
Source: Public Records
Map
Nearby Homes
- 1157 W Orchard St
- 1228 W Woodcrest St
- 1459 W James St
- 1028 W Woodcrest St
- 1560 W Athol St
- 806 S Sandalwood Ave
- 1154 S Spruce Ave
- 687 S Mandarin Ln
- 1510 W Merrill Ave
- 778 Bloomington Ave
- 703 W Montrose St
- 646 S Fillmore Ave
- 687 S Fillmore Ave
- 18264 Pine Ave Unit a & B
- 18264 Pine Ave
- 9971 Cedar Ave
- 9050 Dumond Dr
- 520 W Randall Ave
- 9824 Linden Ave
- 9967 Cedar Ave
- 858 S Vine Ave
- 838 S Vine Ave
- 847 N Church Ave
- 847 S Church Ave
- 835 S Church Ave
- 859 S Church Ave
- 868 S Vine Ave
- 821 S Church Ave
- 847 S Vine Ave
- 837 S Vine Ave
- 828 S Vine Ave
- 857 S Vine Ave
- 871 S Church Ave
- 867 S Vine Ave
- 878 S Vine Ave
- 1196 W Pinedale Ave
- 809 S Church Ave
- 854 S Driftwood Ave
- 883 Church Ave
- 1186 W Pinedale Ave