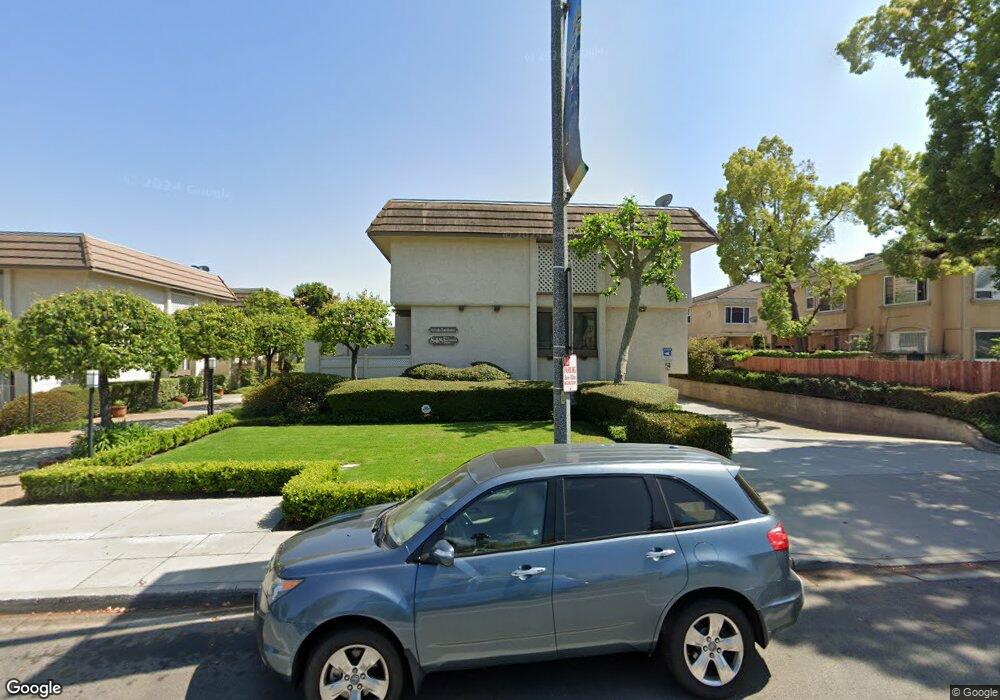
848 W Huntington Dr Unit 27 Arcadia, CA 91007
Estimated Value: $775,560 - $858,000
2
Beds
3
Baths
1,425
Sq Ft
$582/Sq Ft
Est. Value
About This Home
This home is located at 848 W Huntington Dr Unit 27, Arcadia, CA 91007 and is currently estimated at $829,140, approximately $581 per square foot. 848 W Huntington Dr Unit 27 is a home located in Los Angeles County with nearby schools including Hugo Reid Elementary School, Foothills Middle School, and Arcadia High School.
Ownership History
Date
Name
Owned For
Owner Type
Purchase Details
Closed on
Feb 28, 2011
Sold by
Starnes Vaughn A and Starnes Julie A
Bought by
Chen Ting
Current Estimated Value
Home Financials for this Owner
Home Financials are based on the most recent Mortgage that was taken out on this home.
Original Mortgage
$100,000
Outstanding Balance
$4,626
Interest Rate
4.83%
Mortgage Type
New Conventional
Estimated Equity
$824,514
Purchase Details
Closed on
May 27, 2004
Sold by
Starnes Vaughn A and Starnes Julie A
Bought by
Starnes Vaughn A
Purchase Details
Closed on
Sep 24, 1998
Sold by
Daily Peter P
Bought by
Quesada Julie Ann
Home Financials for this Owner
Home Financials are based on the most recent Mortgage that was taken out on this home.
Original Mortgage
$167,850
Interest Rate
6.88%
Create a Home Valuation Report for This Property
The Home Valuation Report is an in-depth analysis detailing your home's value as well as a comparison with similar homes in the area
Home Values in the Area
Average Home Value in this Area
Purchase History
| Date | Buyer | Sale Price | Title Company |
|---|---|---|---|
| Chen Ting | $415,000 | Lawyers Title | |
| Starnes Vaughn A | -- | -- | |
| Starnes Vaughn A | -- | -- | |
| Quesada Julie Ann | $186,500 | Southland Title Corporation | |
| Quesada Julie Ann | -- | Southland Title Corporation |
Source: Public Records
Mortgage History
| Date | Status | Borrower | Loan Amount |
|---|---|---|---|
| Open | Chen Ting | $100,000 | |
| Previous Owner | Quesada Julie Ann | $167,850 |
Source: Public Records
Tax History Compared to Growth
Tax History
| Year | Tax Paid | Tax Assessment Tax Assessment Total Assessment is a certain percentage of the fair market value that is determined by local assessors to be the total taxable value of land and additions on the property. | Land | Improvement |
|---|---|---|---|---|
| 2025 | $6,271 | $531,675 | $366,922 | $164,753 |
| 2024 | $6,271 | $521,251 | $359,728 | $161,523 |
| 2023 | $6,143 | $511,031 | $352,675 | $158,356 |
| 2022 | $5,947 | $501,011 | $345,760 | $155,251 |
| 2021 | $5,839 | $491,188 | $338,981 | $152,207 |
| 2019 | $5,703 | $476,622 | $328,928 | $147,694 |
| 2018 | $5,562 | $467,278 | $322,479 | $144,799 |
| 2016 | $5,399 | $449,134 | $309,957 | $139,177 |
| 2015 | $5,307 | $442,389 | $305,302 | $137,087 |
| 2014 | $5,239 | $433,724 | $299,322 | $134,402 |
Source: Public Records
Map
Nearby Homes
- 914 Fairview Ave Unit 15
- 1017 Golden Ave W
- 726 W Huntington Dr Unit B
- 833 W Duarte Rd
- 1107 Okoboji Dr
- 903 Sunset Blvd Unit B
- 903 Sunset Blvd Unit A
- 905 Sunset Blvd Unit B
- 905 W Duarte Rd Unit A
- 1117 Okoboji Dr
- 1126 Fairview Ave Unit 106
- 1150 Okoboji Dr
- 1004 W Duarte Rd Unit 6
- 618 Fairview Ave Unit 109
- 618 Fairview Ave Unit 112
- 412 S Old Ranch Rd
- 1214 Temple City Blvd Unit 8
- 1228 Temple City Blvd
- 584 W Huntington Dr Unit A
- 801 S Michillinda Ave
- 848 W Huntington Dr Unit 42
- 848 W Huntington Dr Unit 41
- 848 W Huntington Dr Unit 40
- 848 W Huntington Dr Unit 39
- 848 W Huntington Dr Unit 37
- 848 W Huntington Dr Unit 36
- 848 W Huntington Dr Unit 35
- 848 W Huntington Dr Unit 34
- 848 W Huntington Dr Unit 33
- 848 W Huntington Dr Unit 32
- 848 W Huntington Dr Unit 31
- 848 W Huntington Dr Unit 30
- 848 W Huntington Dr Unit 29
- 848 W Huntington Dr Unit 28
- 848 W Huntington Dr Unit 26
- 848 W Huntington Dr Unit 25
- 848 W Huntington Dr Unit 24
- 848 W Huntington Dr Unit 23
- 848 W Huntington Dr Unit 6
- 848 W Huntington Dr Unit 5