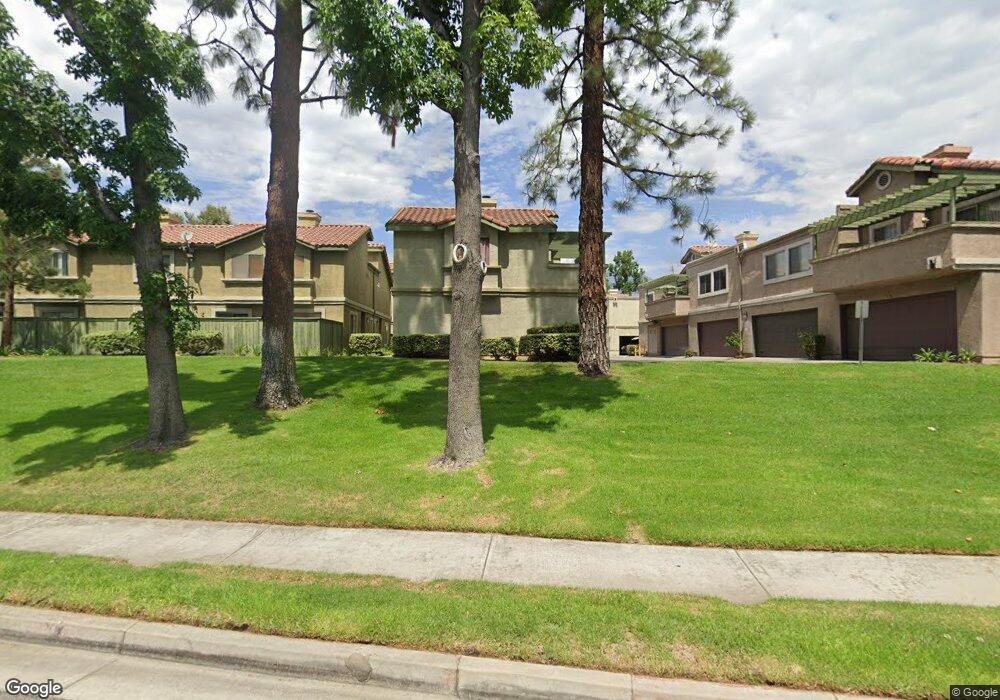
8482 Spring Desert Place Unit 77 Rancho Cucamonga, CA 91730
Estimated Value: $449,000 - $469,000
2
Beds
2
Baths
1,001
Sq Ft
$456/Sq Ft
Est. Value
About This Home
This home is located at 8482 Spring Desert Place Unit 77, Rancho Cucamonga, CA 91730 and is currently estimated at $456,231, approximately $455 per square foot. 8482 Spring Desert Place Unit 77 is a home located in San Bernardino County with nearby schools including Cucamonga Elementary, Rancho Cucamonga Middle, and Chaffey High School.
Ownership History
Date
Name
Owned For
Owner Type
Purchase Details
Closed on
Apr 11, 2017
Sold by
Syed Mansur A
Bought by
Syed Mansur A
Current Estimated Value
Home Financials for this Owner
Home Financials are based on the most recent Mortgage that was taken out on this home.
Original Mortgage
$146,000
Outstanding Balance
$121,560
Interest Rate
4.23%
Mortgage Type
New Conventional
Estimated Equity
$334,671
Purchase Details
Closed on
Jul 6, 2009
Sold by
Reid Patricia A
Bought by
Syed Mansur A and Syed Sulaiman A
Home Financials for this Owner
Home Financials are based on the most recent Mortgage that was taken out on this home.
Original Mortgage
$104,000
Interest Rate
5.2%
Mortgage Type
New Conventional
Purchase Details
Closed on
Dec 10, 2004
Sold by
Wilkiewicz Patti
Bought by
Wilkiewicz John M
Home Financials for this Owner
Home Financials are based on the most recent Mortgage that was taken out on this home.
Original Mortgage
$196,000
Interest Rate
7.62%
Mortgage Type
Purchase Money Mortgage
Create a Home Valuation Report for This Property
The Home Valuation Report is an in-depth analysis detailing your home's value as well as a comparison with similar homes in the area
Home Values in the Area
Average Home Value in this Area
Purchase History
| Date | Buyer | Sale Price | Title Company |
|---|---|---|---|
| Syed Mansur A | -- | Title 365 | |
| Syed Mansur A | $139,000 | None Available | |
| Wilkiewicz John M | -- | New Century Title Company | |
| Reid Patricia A | $245,000 | New Century Title Company |
Source: Public Records
Mortgage History
| Date | Status | Borrower | Loan Amount |
|---|---|---|---|
| Open | Syed Mansur A | $146,000 | |
| Previous Owner | Syed Mansur A | $104,000 | |
| Previous Owner | Reid Patricia A | $196,000 | |
| Closed | Reid Patricia A | $49,000 |
Source: Public Records
Tax History Compared to Growth
Tax History
| Year | Tax Paid | Tax Assessment Tax Assessment Total Assessment is a certain percentage of the fair market value that is determined by local assessors to be the total taxable value of land and additions on the property. | Land | Improvement |
|---|---|---|---|---|
| 2025 | $2,825 | $263,798 | $89,427 | $174,371 |
| 2024 | $2,825 | $258,626 | $87,674 | $170,952 |
| 2023 | $2,762 | $253,555 | $85,955 | $167,600 |
| 2022 | $2,714 | $248,584 | $84,270 | $164,314 |
| 2021 | $2,691 | $243,710 | $82,618 | $161,092 |
| 2020 | $2,644 | $241,211 | $81,771 | $159,440 |
| 2019 | $2,631 | $236,482 | $80,168 | $156,314 |
| 2018 | $2,567 | $231,845 | $78,596 | $153,249 |
| 2017 | $1,720 | $154,599 | $54,110 | $100,489 |
| 2016 | $1,698 | $151,568 | $53,049 | $98,519 |
| 2015 | $1,687 | $149,291 | $52,252 | $97,039 |
| 2014 | $1,639 | $146,366 | $51,228 | $95,138 |
Source: Public Records
Map
Nearby Homes
- 8430 Spring Desert Place Unit B
- 8426 Western Trail Place Unit E
- 8401 Sunset Trail Place Unit E
- 8541 Creekside Place
- 10312 Sparkling Dr Unit 3
- 8530 Willow Dr
- 10349 Cooks Dr Unit 2
- 10382 Sparkling Dr Unit 1
- 8656 Harvest Place Unit 75
- 9999 Foothill Blvd Unit 160
- 9999 Foothill Blvd Unit 94
- 1 Hoffman Rd
- 10108 24th St
- 10026 10026 Foothill Blvd
- 10312 24th St
- 10353 25th St
- 10322 24th St
- 10113 Dorset St
- 10288 Effen St
- 8252 Malachite Ave
- 8482 Spring Desert Place
- 8482 Spring Desert Place Unit E
- 8482 Spring Desert Place Unit H
- 8482 Spring Desert Place Unit G
- 8482 Spring Desert Place Unit F
- 8482 Spring Desert Place Unit D
- 8482 Spring Desert Place Unit C
- 8482 Spring Desert Place Unit B
- 8482 Spring Desert Place Unit A
- 8462G Spring Desert Place
- 8481 Spring Desert Place
- 8481 Spring Desert Place Unit H
- 8481 Spring Desert Place Unit G
- 8481 Spring Desert Place Unit F
- 8481 Spring Desert Place Unit E
- 8481 Spring Desert Place Unit D
- 8481 Spring Desert Place Unit C
- 8481 Spring Desert Place Unit B
- 8481 Spring Desert Place Unit A
- 8461 Spring Desert Place Unit F